Liste des pays par tranches d'âge
La liste des pays par tranches d'âge présente la répartition en trois classes d'âge d'une population à un instant donné : l'enfance et l'adolescence (0-14 ans), la population active (15 à 64 ans) et le troisième âge, grosso modo l'âge de la retraite dans les pays où elle est appliquée (plus de 65 ans).
Liste des pays
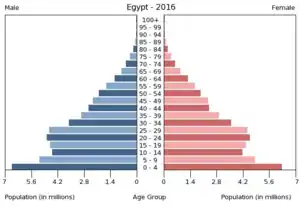
Pyramide des âges de l'Égypte en 2016.

Pyramide des âges d'Arabie Saoudite en 2016.
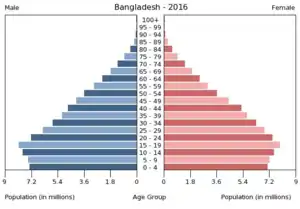
Pyramide des âges du Bangladesh en 2016.
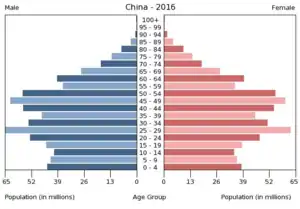
Pyramide des âges de la Chine en 2016.

Pyramide des âges de l'Allemagne en 2016.
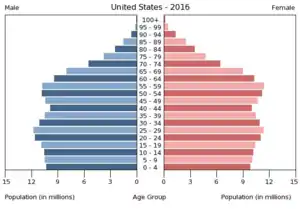
Pyramide des âges des États-Unis en 2016.
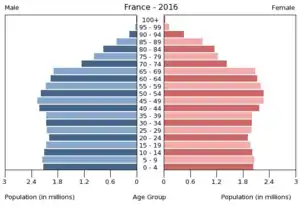
Pyramide des âges de la France en 2016.
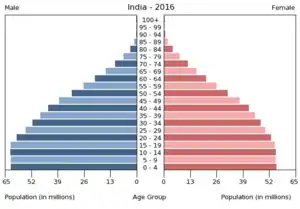
Pyramide des âges de l'Inde en 2016.
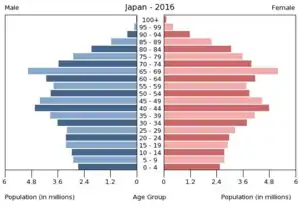
Pyramide des âges du japon en 2016.

Pyramide des âges du Congo en 2016.

Pyramide des âges de la Malaisie en 2016.
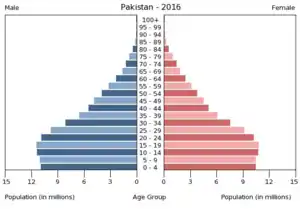
Pyramide des âges du Pakistan en 2016.

Pyramide des âges du Russie en 2016.

Pyramide des âges de l'Espagne en 2016.
Les données sont issues de la Banque mondiale, en date de 2016, en pourcentage de la population totale.
| Pays | Tranches d'âge | ||
|---|---|---|---|
| De 0 à 14 ans[1] | de 15 à 64 ans[2] | Plus de 65 ans[3] | |
| 43,3 % | 54,2 % | 2,5 % | |
| 33,5 % | 61,2 % | 5,3 % | |
| 18,4 % | 68,9 % | 12,7 % | |
| 28,9 % | 65,0 % | 6,1 % | |
| 47,6 % | 50,1 % | 2,3 % | |
| 39,2 % | 57,9 % | 2,9 % | |
| 25,0 % | 63,9 % | 11,1 % | |
| 18,5 % | 70,4 % | 11,1 % | |
| 22,5 % | 71,7 % | 5,8 % | |
| 40,9 % | 55,6 % | 3,5 % | |
| 18,8 % | 65,9 % | 15,3 % | |
| 20,8 % | 70,6 % | 8,6 % | |
| 21,3 % | 76,2 % | 2,5 % | |
| 28,9 % | 66,1 % | 5,0 % | |
| 19,2 % | 66,2 % | 14,6 % | |
| 17,0 % | 64,5 % | 18,5 % | |
| 32,0 % | 64,2 % | 3,8 % | |
| 41,9 % | 55,2 % | 2,9 % | |
| 26,3 % | 68,5 % | 5,2 % | |
| 32,0 % | 61,4 % | 6,6 % | |
| 13,3 % | 70,7 % | 16,0 % | |
| 31,9 % | 64,4 % | 3,7 % | |
| 22,6 % | 69,3 % | 8,1 % | |
| 14,2 % | 65,4 % | 20,4 % | |
| 45,4 % | 52,2 % | 2,4 % | |
| 45,0 % | 52,5 % | 2,5 % | |
| 19,9 % | 68,8 % | 11,3 % | |
| 17,3 % | 72,7 % | 10,0 % | |
| 21,9 % | 68,9 % | 9,2 % | |
| 16,6 % | 64,0 % | 19,4 % | |
| 12,8 % | 65,7 % | 21,5 % | |
| 29,6 % | 63,6 % | 6,8 % | |
| 32,5 % | 63,3 % | 4,3 % | |
| 28,7 % | 64,4 % | 6,9 % | |
| 26,4 % | 65,2 % | 8,4 % | |
| 42,3 % | 54,6 % | 3,1 % | |
| 44,2 % | 53,0 % | 2,8 % | |
| 16,2 % | 64,7 % | 19,1 % | |
| 28,6 % | 65,3 % | 6,1 % | |
| 16,4 % | 62,6 % | 21,0 % | |
| 18,4 % | 62,1 % | 19,5 % | |
| 37,0 % | 57,9 % | 5,1 % | |
| 46,2 % | 51,5 % | 2,3 % | |
| 17,6 % | 68,3 % | 14,1 % | |
| 38,8 % | 57,8 % | 3,4 % | |
| 14,6 % | 63,8 % | 21,6 % | |
| 36,2 % | 58,9 % | 4,9 % | |
| 40,7 % | 56,1 % | 3,2 % | |
| 42,4 % | 54,5 % | 3,1 % | |
| 28,1 % | 66,7 % | 5,2 % | |
| 33,3 % | 62,0 % | 4,7 % | |
| 31,0 % | 64,0 % | 5,0 % | |
| 12,3 % | 72,1 % | 15,6 % | |
| 28,4 % | 65,8 % | 5,8 % | |
| 27,5 % | 67,2 % | 5,3 % | |
| 40,9 % | 56,0 % | 3,1 % | |
| 23,6 % | 71,2 % | 5,2 % | |
| 21,8 % | 64,7 % | 13,5 % | |
| 20,2 % | 65,7 % | 14,1 % | |
| 27,9 % | 60,6 % | 11,8 % | |
| 13,6 % | 63,7 % | 22,7 % | |
| 23,1 % | 67,6 % | 9,3 % | |
| 12,8 % | 60,3 % | 26,9 % | |
| 39,9 % | 57,2 % | 2,9 % | |
| 35,3 % | 60,9 % | 3,8 % | |
| 31,4 % | 64,3 % | 4,3 % | |
| 42,3 % | 54,5 % | 3,2 % | |
| 16,0 % | 67,5 % | 16,5 % | |
| 29,3 % | 66,2 % | 4,5 % | |
| 27,3 % | 65,9 % | 6,8 % | |
| 15,6 % | 83,1 % | 1,3 % | |
| 41,7 % | 55,5 % | 2,8 % | |
| 31,9 % | 63,8 % | 4,3 % | |
| 23,9 % | 68,8 % | 7,3 % | |
| 40,1 % | 57,1 % | 2,8 % | |
| 45,8 % | 51,2 % | 3,0 % | |
| 42,6 % | 53,7 % | 3,7 % | |
| 16,1 % | 69,6 % | 14,3 % | |
| 13,7 % | 72,7 % | 13,6 % | |
| 14,8 % | 65,9 % | 19,3 % | |
| 22,6 % | 75,4 % | 2,0 % | |
| 34,4 % | 61,7 % | 3,9 % | |
| 36,0 % | 59,9 % | 4,1 % | |
| 15,0 % | 65,5 % | 19,5 % | |
| 23,5 % | 68,2 % | 8,3 % | |
| 42,0 % | 55,0 % | 3,0 % | |
| 29,6 % | 65,8 % | 4,6 % | |
| 14,7 % | 66,5 % | 18,8 % | |
| 16,5 % | 69,4 % | 14,1 % | |
| 13,4 % | 77,1 % | 9,5 % | |
| 41,4 % | 55,7 % | 2,9 % | |
| 44,9 % | 51,6 % | 3,5 % | |
| 25,0 % | 69,1 % | 5,9 % | |
| 27,4 % | 67,9 % | 4,7 % | |
| 47,4 % | 50,0 % | 2,5 % | |
| 14,2 % | 66,1 % | 19,7 % | |
| 27,2 % | 66,5 % | 6,3 % | |
| 39,8 % | 57,0 % | 3,2 % | |
| 18,9 % | 71,1 % | 10,0 % | |
| 16,9 % | 70,4 % | 12,7 % | |
| 27,2 % | 66,2 % | 6,6 % | |
| 15,7 % | 73,9 % | 10,4 % | |
| 28,5 % | 67,3 % | 4,1 % | |
| 18,4 % | 67,5 % | 14,1 % | |
| 45,1 % | 51,5 % | 3,4 % | |
| 27,0 % | 67,5 % | 5,5 % | |
| 36,6 % | 59,8 % | 3,6 % | |
| 31,8 % | 62,5 % | 5,7 % | |
| 20,1 % | 64,7 % | 15,2 % | |
| 29,5 % | 65,2 % | 5,3 % | |
| 16,4 % | 64,9 % | 18,7 % | |
| 44,0 % | 53,3 % | 2,7 % | |
| 50,5 % | 45,9 % | 2,6 % | |
| 21,0 % | 69,5 % | 9,5 % | |
| 17,9 % | 65,5 % | 16,6 % | |
| 21,1 % | 76,2 % | 2,7 % | |
| 14,2 % | 66,9 % | 18,9 % | |
| 42,8 % | 51,7 % | 5,5 % | |
| 34,9 % | 60,6 % | 4,5 % | |
| 26,9 % | 65,3 % | 7,8 % | |
| 36,8 % | 60,1 % | 3,1 % | |
| 29,7 % | 64,1 % | 6,2 % | |
| 27,3 % | 65,4 % | 7,0 % | |
| 31,7 % | 63,6 % | 4,7 % | |
| 15,0 % | 68,9 % | 16,1 % | |
| 13,8 % | 65,0 % | 21,2 % | |
| 18,6 % | 66,6 % | 14,8 % | |
| 40,6 % | 56,5 % | 2,9 % | |
| 15,4 % | 66,9 % | 17,7 % | |
| 17,2 % | 69,2 % | 13,6 % | |
| 39,2 % | 57,4 % | 3,4 % | |
| 45,7 % | 51,4 % | 2,9 % | |
| 28,3 % | 68,7 % | 3,0 % | |
| 17,5 % | 62,3 % | 20,2 % | |
| 14,8 % | 66,9 % | 18,3 % | |
| 43,8 % | 53,3 % | 2,9 % | |
| 16,2 % | 66,2 % | 17,6 % | |
| 23,6 % | 69,4 % | 7,0 % | |
| 42,1 % | 55,2 % | 2,7 % | |
| 41,5 % | 55,6 % | 2,9 % | |
| 15,3 % | 72,4 % | 12,3 % | |
| 15,1 % | 70,5 % | 14,4 % | |
| 15,0 % | 66,6 % | 18,4 % | |
| 46,6 % | 50,6 % | 2,8 % | |
| 14,7 % | 66,2 % | 19,1 % | |
| 24,3 % | 66,0 % | 9,7 % | |
| 28,9 % | 66,0 % | 5,1 % | |
| 41,9 % | 54,6 % | 3,5 % | |
| 40,2 % | 56,5 % | 3,3 % | |
| 26,5 % | 66,5 % | 7,0 % | |
| 37,3 % | 59,1 % | 3,6 % | |
| 35,0 % | 61,9 % | 3,1 % | |
| 45,1 % | 51,7 % | 3,2 % | |
| 17,4 % | 71,7 % | 10,9 % | |
| 42,1 % | 55,1 % | 2,8 % | |
| 20,7 % | 69,6 % | 9,7 % | |
| 47,5 % | 50,0 % | 2,5 % | |
| 15,1 % | 66,3 % | 18,6 % | |
| 23,5 % | 68,7 % | 7,8 % | |
| 25,4 % | 66,9 % | 7,7 % | |
| 28,1 % | 67,7 % | 4,2 % | |
| 47,8 % | 49,7 % | 2,5 % | |
| 15,1 % | 69,3 % | 15,6 % | |
| 14,5 % | 67,3 % | 18,2 % | |
| 21,2 % | 64,2 % | 14,6 % | |
| 28,5 % | 66,7 % | 4,7 % | |
| 36,1 % | 59,6 % | 4,3 % | |
| 27,8 % | 65,8 % | 6,4 % | |
| 14,1 % | 84,7 % | 1,2 % | |
| 18,9 % | 65,9 % | 15,2 % | |
| 17,8 % | 64,2 % | 18,0 % | |
| 23,1 % | 70,0 % | 6,9 % | |
| 16,5 % | 69,4 % | 14,1 % | |
| 38,8 % | 57,3 % | 3,9 % | |
| 16,4 % | 70,5 % | 13,1 % | |
| Pays | Tranches d'âge | ||
| De 0 à 14 ans | De 15 à 64 ans | Plus de 65 ans | |
Notes et références
- (de) Cet article est partiellement ou en totalité issu de l’article de Wikipédia en allemand intitulé « Liste der Länder nach Altersstruktur » (voir la liste des auteurs).
- (en) « Population ages 0-14 (% of total) | Data » (consulté le )
- (en) « Population ages 15-64 (% of total) | Data » (consulté le )
- (en) « Population ages 65 and above (% of total) | Data » (consulté le )
Articles connexes
Cet article est issu de wikipedia. Text licence: CC BY-SA 4.0, Des conditions supplémentaires peuvent s’appliquer aux fichiers multimédias.