Élections législatives de 2007 dans le Bas-Rhin
Les élections législatives françaises de 2007 se déroulent les 10 et 17 juin 2007. Dans le département du Bas-Rhin, neuf députés sont à élire dans le cadre de neuf circonscriptions.
| Élections législatives de 2007 dans le Bas-Rhin | |||||
| 9 sièges de députés à l'Assemblée nationale | |||||
|---|---|---|---|---|---|
| et | |||||
| Corps électoral et résultats | |||||
| Inscrits au 1er tour | 723 644 | ||||
| Votants au 1er tour | 402 879 | ||||
| 55,67 % | |||||
| Votes exprimés au 1er tour | 395 557 | ||||
| Inscrits au 2d tour | 171 056 | ||||
| Votants au 2d tour | 87 495 | ||||
| 51,15 % | |||||
| Votes exprimés au 2d tour | 85 601 | ||||
| Majorité présidentielle | |||||
| Voix au 1er tour | 223 973 | ||||
| 56,62 % | |||||
| Voix au 2e tour | 43 793 | ||||
| 51,16 % | |||||
| Députés élus | 8 | ||||
| Gauche parlementaire | |||||
| Voix au 1er tour | 74 391 | ||||
| 18,81 % | |||||
| Voix au 2e tour | 41 808 | ||||
| 48,84 % | |||||
| Députés élus | 1 | ||||
| UDF-Mouvement démocrate | |||||
| Voix au 1er tour | 49 936 | ||||
| 12,62 % | |||||
| Députés élus | 0 | ||||
| Front national | |||||
| Voix au 1er tour | 22 574 | ||||
| 5,71 % | |||||
| Députés élus | 0 | ||||
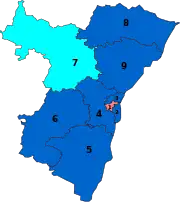
| Députés sortants par circonscription | |||||
| |||||
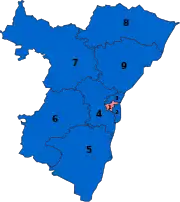
| Députés élus par circonscription | |||||
| |||||
Élus
| Circonsription | Député sortant | Parti | Député élu ou réélu | Parti | ||
|---|---|---|---|---|---|---|
| 1re | Armand Jung | PS | Armand Jung | PS | ||
| 2e | Marc Reymann | UMP | Jean-Philippe Maurer | UMP | ||
| 3e | André Schneider | UMP | André Schneider | UMP | ||
| 4e | Yves Bur | UMP | Yves Bur | UMP | ||
| 5e | Antoine Herth | UMP | Antoine Herth | UMP | ||
| 6e | Alain Ferry | UMP | Alain Ferry | UMP | ||
| 7e | Émile Blessig | UMP | Émile Blessig | UMP | ||
| 8e | Frédéric Reiss | PRV | Frédéric Reiss | PRV | ||
| 9e | Bernard Schreiner | UMP | François Loos | UMP | ||
Résultats
Résultats à l'échelle du département
| Parti | Premier tour | Second tour | Sièges | |||
|---|---|---|---|---|---|---|
| Voix | % | Voix | % | |||
| Union pour un mouvement populaire | 194 161 | 49,09 | 43 793 | 51,16 | 7 | |
| Parti radical | 25 260 | 6,39 | 1 | |||
| Divers droite | 4 552 | 1,15 | 0 | |||
| Majorité présidentielle | 223 973 | 56,62 | 43 793 | 51,16 | 8 | |
| Parti socialiste | 54 443 | 13,76 | 41 808 | 48,84 | 1 | |
| Les Verts | 16 923 | 4,28 | 0 | |||
| Parti communiste français | 2 207 | 0,56 | 0 | |||
| Divers gauche dont MRC et PRG | 818 | 0,21 | 0 | |||
| Gauche parlementaire | 74 391 | 18,81 | 41 808 | 48,84 | 1 | |
| UDF–Mouvement démocrate | 49 936 | 12,62 | 0 | |||
| Front national | 22 574 | 5,71 | 0 | |||
| Extrême gauche dont LCR, LO, SÉGA et PT | 9 587 | 2,42 | 0 | |||
| Divers écologiste dont MÉI et GÉ | 6 901 | 1,74 | 0 | |||
| Divers | 5 512 | 1,39 | 0 | |||
| Extrême droite dont MNR | 2 683 | 0,68 | 0 | |||
| Inscrits | 723 644 | 100,00 | 171 056 | 100,00 | 9 | |
| Abstentions | 320 765 | 44,33 | 83 561 | 48,85 | ||
| Votants | 402 879 | 55,67 | 87 495 | 51,15 | ||
| Blancs et nuls | 7 322 | 1,82 | 1 894 | 2,16 | ||
| Exprimés | 395 557 | 98,18 | 85 601 | 97,84 | ||
| Source : Ministère de l'Intérieur - Bas-Rhin | ||||||
Première circonscription (Strasbourg-Centre)
| Candidat | Parti | Premier tour | Second tour | ||||
|---|---|---|---|---|---|---|---|
| Voix | % | Voix | % | ||||
| Armand Jung sortant réélu | PS | 9 718 | 32,96 | 15 994 | 56,27 | ||
| Frédérique Loutrel | UMP | 9 191 | 31,17 | 12 428 | 43,73 | ||
| Chantal Cutajar | UDF–MoDem | 3 461 | 11,74 | ||||
| Martine Calderoli-Lotz | diss. UMP | 2 489 | 8,44 | ||||
| Laurent Fritz | Les Verts | 1 426 | 4,84 | ||||
| Bernadette Brenner | FN | 939 | 3,18 | ||||
| Antonio Gomez | LCR | 673 | 2,28 | ||||
| Françoise Werckmann | MÉI | 416 | 1,41 | ||||
| Christian Grosse | PCF | 345 | 1,17 | ||||
| Sonia J. Fath | Divers | 214 | 0,73 | ||||
| Jean-Luc Schaffhauser | Divers | 190 | 0,64 | ||||
| Jacques Barthel | Divers | 157 | 0,53 | ||||
| Pierrette Morinaud | LO | 140 | 0,47 | ||||
| Stéphanie Brasseur | MNR | 125 | 0,42 | ||||
| Inscrits | 52 670 | 100,00 | 52 672 | 100,00 | |||
| Abstentions | 22 931 | 43,54 | 23 708 | 45,01 | |||
| Votants | 29 739 | 56,46 | 28 964 | 54,99 | |||
| Blancs et nuls | 255 | 0,86 | 542 | 1,87 | |||
| Exprimés | 29 484 | 99,14 | 28 422 | 98,13 | |||
Deuxième circonscription (Strasbourg-Sud)
| Candidat | Parti | Premier tour | Second tour | ||||
|---|---|---|---|---|---|---|---|
| Voix | % | Voix | % | ||||
| Jean-Philippe Maurer élu | UMP | 10 797 | 38,87 | 13 211 | 51,32 | ||
| Philippe Bies | PS | 7 100 | 25,56 | 12 530 | 48,68 | ||
| Pascale Jurdant-Pfeiffer | UDF–MoDem | 3 799 | 13,68 | ||||
| Yann Wehrling | Les Verts | 1 642 | 5,91 | ||||
| Xavier Codderens | FN | 1 258 | 4,53 | ||||
| Francis Lalanne | MÉI | 975 | 3,51 | ||||
| Jean-Baptiste Metz | PCF | 413 | 1,49 | ||||
| Mohamed Er Rachidi | Divers | 334 | 1,2 | ||||
| Philippe Morel | SÉGA | 273 | 0,98 | ||||
| FabienCnapelynck | GÉ | 220 | 0,79 | ||||
| Roland Robert | LO | 214 | 0,77 | ||||
| Géraldine Grun-Nevers | Divers droite | 206 | 0,74 | ||||
| Patrick Beaufrère | DLR | 151 | 0,54 | ||||
| Armand Tenesso | Divers | 137 | 0,49 | ||||
| Valérie Broussolle | PT | 101 | 0,36 | ||||
| Michèle Depret | MRC | 79 | 0,28 | ||||
| François Bunner | Divers | 77 | 0,28 | ||||
| Inscrits | 52 296 | 100,00 | 51 496 | 100,00 | |||
| Abstentions | 24 264 | 46,4 | 25 170 | 48,88 | |||
| Votants | 28 032 | 53,6 | 26 326 | 51,12 | |||
| Blancs et nuls | 256 | 0,91 | 585 | 2,22 | |||
| Exprimés | 27 776 | 99,09 | 25 741 | 97,78 | |||
Troisième circonscription (Strasbourg-Nord)
| Candidat | Parti | Premier tour | Second tour | ||||
|---|---|---|---|---|---|---|---|
| Voix | % | Voix | % | ||||
| André Schneider sortant réélu | UMP | 16 154 | 47,18 | 18 154 | 57,75 | ||
| Zoubida Naili | PS | 7 133 | 20,83 | 13 284 | 42,25 | ||
| Bornia Tarall | UDF–MoDem | 3 515 | 10,27 | ||||
| Andrée Buchmann | Les Verts | 1 920 | 5,61 | ||||
| Natacha Lugonja | FN | 1 835 | 5,36 | ||||
| Mohamed Latrèche | Divers | 788 | 2,3 | ||||
| Jean-Luc Muller | LCR | 714 | 2,09 | ||||
| Jacques Werckmann | MÉI | 479 | 1,4 | ||||
| Claude Weber | Divers | 473 | 1,38 | ||||
| Marie-Claire Lechêne | LO | 325 | 0,95 | ||||
| Julien Gorrand | PCF | 319 | 0,93 | ||||
| Dominique Jobredeaux | Divers | 252 | 0,74 | ||||
| David Jacquart | MNR | 216 | 0,63 | ||||
| Yasmina Benchohra-Sadarnac | Divers | 113 | 0,33 | ||||
| Inscrits | 66 888 | 100,00 | 66 888 | 100,00 | |||
| Abstentions | 32 233 | 48,19 | 34 683 | 51,85 | |||
| Votants | 34 655 | 51,81 | 32 205 | 48,15 | |||
| Blancs et nuls | 419 | 1,21 | 767 | 2,38 | |||
| Exprimés | 34 236 | 98,79 | 31 438 | 97,62 | |||
Quatrième circonscription (Strasbourg-Campagne)
| Candidat | Parti | Premier tour | |||||
|---|---|---|---|---|---|---|---|
| Voix | % | ||||||
| Yves Bur sortant réélu | UMP | 36 365 | 56,84 | ||||
| Claude Froehly | PS | 10 078 | 15,75 | ||||
| Anne Meunier | UDF–MoDem | 7 123 | 11,13 | ||||
| Jacques Fernique | Les Verts | 3 349 | 5,23 | ||||
| Marie-Madeleine Heitz | FN | 3 235 | 5,06 | ||||
| Fabien Foesser | MÉI | 1 147 | 1,79 | ||||
| Michel Oswald | LCR | 927 | 1,45 | ||||
| Anthony Meckert | Divers | 550 | 0,86 | ||||
| Frédéric Lalande | MNR | 459 | 0,72 | ||||
| Ariane Henry | PCF | 381 | 0,6 | ||||
| Marc Baud-Berthier | LO | 366 | 0,57 | ||||
| Inscrits | 114 052 | 100,00 | |||||
| Abstentions | 49 125 | 43,07 | |||||
| Votants | 64 927 | 56,93 | |||||
| Blancs et nuls | 947 | 1,46 | |||||
| Exprimés | 63 980 | 98,54 | |||||
Cinquième circonscription (Sélestat)
| Candidat | Parti | Premier tour | |||||
|---|---|---|---|---|---|---|---|
| Voix | % | ||||||
| Antoine Herth sortant réélu | UMP | 31 277 | 58,01 | ||||
| Danièle Meyer | UDF–MoDem | 6 812 | 12,63 | ||||
| Christiane Hammann | PS | 5 566 | 10,32 | ||||
| Christian Cotelle | FN | 3 606 | 6,69 | ||||
| Michèle Gartner | Les Verts | 1 885 | 3,5 | ||||
| Clément Renaudet | MÉI | 1 258 | 2,33 | ||||
| Monique Funck | CNIP | 742 | 1,38 | ||||
| Patrick Dutter | LO | 715 | 1,33 | ||||
| Marie-Claude Richez | LCR | 680 | 1,26 | ||||
| Auguste Bildstein | Divers | 452 | 0,84 | ||||
| Edmond Guillet | MNR | 374 | 0,69 | ||||
| Jean-Louis Kubiack | PCF | 339 | 0,63 | ||||
| Gabrielle Domin | PRG | 213 | 0,4 | ||||
| Inscrits | 99 091 | 100,00 | |||||
| Abstentions | 43 739 | 44,14 | |||||
| Votants | 55 352 | 55,86 | |||||
| Blancs et nuls | 1 433 | 2,59 | |||||
| Exprimés | 53 919 | 97,41 | |||||
Sixième circonscription (Obernai)
| Candidat | Parti | Premier tour | |||||
|---|---|---|---|---|---|---|---|
| Voix | % | ||||||
| Alain Ferry sortant réélu | UMP | 31 097 | 67,38 | ||||
| Cédric Baillet | UDF–MoDem | 4 293 | 9,3 | ||||
| Marie-Madeleine Iantzen | PS | 3 883 | 8,41 | ||||
| Nathalie Tomasi | FN | 2 444 | 5,3 | ||||
| Mireille Metz | Les Verts | 1 708 | 3,7 | ||||
| Valérie Acker | LCR | 717 | 1,55 | ||||
| Marie-Noëlle Eastes | MÉI | 489 | 1,06 | ||||
| Joël Allain | PCF | 410 | 0,89 | ||||
| Bernadette Lutz | Divers | 407 | 0,88 | ||||
| Jean Meyer | LO | 386 | 0,84 | ||||
| Marie-Jeanne Mailley | MNR | 319 | 0,69 | ||||
| Inscrits | 80 815 | 100,00 | |||||
| Abstentions | 33 886 | 41,93 | |||||
| Votants | 46 929 | 58,07 | |||||
| Blancs et nuls | 776 | 1,65 | |||||
| Exprimés | 46 153 | 98,35 | |||||
Septième circonscription (Saverne)
| Candidat | Parti | Premier tour | |||||
|---|---|---|---|---|---|---|---|
| Voix | % | ||||||
| Émile Blessig sortant réélu | UMP | 27 269 | 60,49 | ||||
| Thierry Carbiener | UDF–MoDem | 6 592 | 14,62 | ||||
| Pascale Delorme | PS | 2 951 | 6,55 | ||||
| Robert Martig | FN | 2 939 | 6,52 | ||||
| Marie-Madeleine Braud | Les Verts | 2 171 | 1,64 | ||||
| Fabienne Schnitzler | MÉI | 739 | 1,64 | ||||
| Liliane Bas | LO | 676 | 1,5 | ||||
| Hervé Thérouse | Divers gauche | 526 | 1,17 | ||||
| Georges Hoffmann | Extrême gauche | 470 | 1,04 | ||||
| Yves Quéneville | Divers | 425 | 0,94 | ||||
| Évelyne Hamm | MNR | 322 | 0,71 | ||||
| Inscrits | 82 832 | 100,00 | |||||
| Abstentions | 36 621 | 44,21 | |||||
| Votants | 46 211 | 55,79 | |||||
| Blancs et nuls | 1 131 | 2,45 | |||||
| Exprimés | 45 080 | 97,55 | |||||
Huitième circonscription (Wissembourg)
| Candidat | Parti | Premier tour | |||||
|---|---|---|---|---|---|---|---|
| Voix | % | ||||||
| Frédéric Reiss sortant réélu | PRV (UMP) | 25 260 | 65,91 | ||||
| Thomas Joerger | UDF–MoDem | 3 488 | 9,1 | ||||
| Ambroise Perrin | PS | 3 339 | 8,71 | ||||
| Laurent Gnaedig | FN | 2 765 | 7,21 | ||||
| Songul Kiraz | Les Verts | 980 | 2,56 | ||||
| Danièle Canton | Extrême gauche | 469 | 1,22 | ||||
| Héloïse Exbrayat | Divers écologiste | 523 | 1,36 | ||||
| Catherine Gsell | LO | 432 | 1,13 | ||||
| Gabriel Bastian | Extrême droite | 381 | 0,99 | ||||
| Christophe Bord | Divers droite | 347 | 0,91 | ||||
| Jean-Philippe Martin | Divers | 342 | 0,89 | ||||
| Inscrits | 70 558 | 100,00 | |||||
| Abstentions | 31 239 | 44,27 | |||||
| Votants | 39 319 | 55,73 | |||||
| Blancs et nuls | 993 | 2,53 | |||||
| Exprimés | 38 326 | 97,47 | |||||
Neuvième circonscription (Haguenau)
| Candidat | Parti | Premier tour | |||||
|---|---|---|---|---|---|---|---|
| Voix | % | ||||||
| François Loos sortant réélu | UMP | 32 011 | 56,55 | ||||
| Claude Kern | UDF–MoDem | 10 853 | 19,17 | ||||
| Leilla Witzmann | PS | 4 675 | 8,26 | ||||
| Jean-Claude Altherr | FN | 3 553 | 6,28 | ||||
| Robert Lindeckert | Les Verts | 1 842 | 3,25 | ||||
| Marion Greib | LCR | 1 006 | 1,78 | ||||
| Christian Weinzorn | MÉI | 655 | 1,16 | ||||
| Jérôme Feuerstein | MPF | 516 | 0,91 | ||||
| Christian Fischer | MNR | 487 | 0,86 | ||||
| Lydia Landeshaupt | Divers | 463 | 0,82 | ||||
| Georges Dizdarevic | LO | 404 | 0,71 | ||||
| Benoit Meyer | Divers | 138 | 0,24 | ||||
| Inscrits | 104 442 | 100,00 | |||||
| Abstentions | 46 727 | 44,74 | |||||
| Votants | 57 715 | 55,26 | |||||
| Blancs et nuls | 1 112 | 1,93 | |||||
| Exprimés | 56 603 | 98,07 | |||||
Articles connexes
Notes et références
Cet article est issu de wikipedia. Text licence: CC BY-SA 4.0, Des conditions supplémentaires peuvent s’appliquer aux fichiers multimédias.