Henley (circonscription du Parlement britannique)
La circonscription de Henley est une circonscription parlementaire britannique, située dans l'Oxfordshire.
Henley
Circonscription parlementaire de la Chambre des Communes
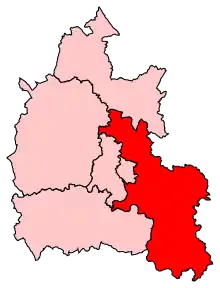
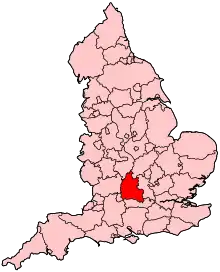
| Comté | Oxfordshire |
|---|---|
| Électeurs inscrits | 73,851 (Décembre 2010[1]) |
| Villes principales | Henley, Thame et Chinnor |
| Création | 1885 |
|---|---|
| Member of Parliament |
John Howell (Conservateur) |
| Créé à partir de | Oxfordshire |
| Parlement européen | Angleterre du Sud-Est |
|---|
Cette circonscription a été créée en 1885 à partir de l'ancienne circonscription de l'Oxfordshire. Depuis 2008, elle est représentée à la Chambre des communes du Parlement britannique par John Howell, du Parti conservateur.
Members of Parliament
| Élection | Membre[2] | Parti | ||
|---|---|---|---|---|
| 1885 | Edward Vernon Harcourt | Conservateur | ||
| 1886 | Francis Parker | Conservateur | ||
| 1895 | Robert Hermon-Hodge | 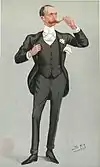 |
Conservateur | |
| 1906 | Philip Morrell | 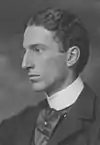 |
Libéral | |
| 1910 | Valentine Fleming | 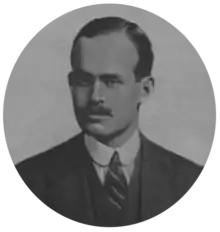 |
Conservateur | |
| Élection partielle 1917 | Sir Robert Hermon-Hodge |  |
Conservateur | |
| 1918 | Reginald Terrell | Coalition Conservateur | ||
| 1922 | Conservateur | |||
| 1924 | Robert Henderson | Conservateur | ||
| Élection partielle 1932 | Gifford Fox | Conservateur | ||
| 1950 | John Hay | 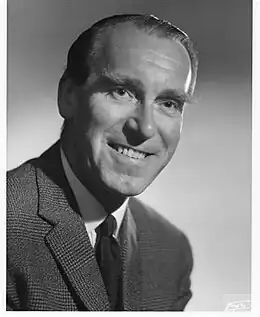 |
Conservateur | |
| février 1974 | Michael Heseltine | .jpg.webp) |
Conservateur | |
| 2001 | Boris Johnson | .jpg.webp) |
Conservateur | |
| Élection partielle 2008 | John Howell | 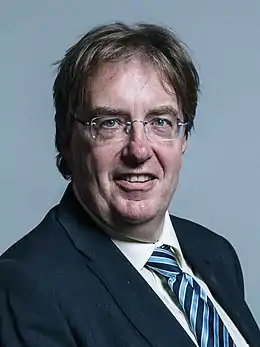 |
Conservateur | |
Élections
Élections dans les années 2010
| Parti | Candidat | Votes | % | ± | |
|---|---|---|---|---|---|
| Conservateur | John Howell | 32,189 | 54,8 | –4.3 | |
| Libéral Démocrate | Laura Coyle | 18,136 | 30,9 | +16.0 | |
| Travailliste | Zaid Marham | 5,698 | 9,7 | –10.4 | |
| Green | Jo Robb | 2,736 | 4,7 | +1.4 | |
| Majorité | 14,053 | 23,9 | –15.9 | ||
| Participation | 58,759 | 76,6 | +0.3 | ||
| Conservateur hold | Swing | ||||
| Parti | Candidat | Votes | % | ± | |
|---|---|---|---|---|---|
| Conservateur | John Howell | 33,749 | 59,1 | +0.6 | |
| Travailliste | Oliver Kavanagh | 11,455 | 20,1 | +7.6 | |
| Libéral Démocrate | Laura Coyle | 8,485 | 14,9 | +3.7 | |
| Green | Robin Bennett | 1,864 | 3,3 | –3.6 | |
| UKIP | Tim Scott | 1,154 | 2,0 | –8.9 | |
| The Radical Party | Patrick Gray | 392 | 0,7 | N/A | |
| Majorité | 22,294 | 39,0 | –7.0 | ||
| Participation | 57,218 | 76,3 | +5.4 | ||
| Conservateur hold | Swing | –3.5 | |||
| Parti | Candidat | Votes | % | ± | |
|---|---|---|---|---|---|
| Conservateur | John Howell[6] | 32,292 | 58,5 | +2.3 | |
| Travailliste | Sam Juthani[7] | 6,917 | 12,5 | +1.6 | |
| Libéral Démocrate | Sue Cooper[8] | 6,205 | 11,2 | –13.9 | |
| UKIP | Christopher Jones[9] | 6,007 | 10,9 | +7.5 | |
| Green | Mark Stevenson[10] | 3,815 | 6,9 | +4.4 | |
| Majorité | 25,375 | 46,0 | +15.0 | ||
| Participation | 55,236 | 70,9 | –0.5 | ||
| Conservateur hold | Swing | ||||
| Parti | Candidat | Votes | % | ± | |
|---|---|---|---|---|---|
| Conservateur | John Howell | 30,054 | 56,2 | +3.0 | |
| Libéral Démocrate | Andy Crick | 13,466 | 25,2 | −0.9 | |
| Travailliste | Richard McKenzie | 5,835 | 10,9 | −4.1 | |
| UKIP | Laurence Hughes | 1,817 | 3,4 | +0.9 | |
| Green | Mark Stevenson | 1,328 | 2,5 | −0.8 | |
| BNP | John Bews | 1,020 | 1,9 | −1.7 | |
| Majorité | 16,588 | 31,0 | +3.5 | ||
| Participation | 53,520 | 71,4 | +3.6 | ||
| Conservateur hold | Swing | +1.9 | |||
Élections dans les années 2000
| Parti | Candidat | Votes | % | ± | |
|---|---|---|---|---|---|
| Conservateur | John Howell | 19,796 | 56,9 | +3.4 | |
| Libéral Démocrate | Stephen Kearney | 9,680 | 27,8 | +1.8 | |
| Green | Mark Stevenson | 1,321 | 3,8 | +0.5 | |
| BNP | Tim Rait | 1,243 | 3,6 | N/A | |
| Travailliste | Richard McKenzie | 1,066 | 3,1 | −11.6 | |
| UKIP | Chris Adams | 843 | 2,4 | −0.1 | |
| Monster Raving Loony | Bananaman Owen | 242 | 0,7 | N/A | |
| Démocrates anglais | Derek Allpass | 157 | 0,4 | N/A | |
| Indépendant | Amanda Harrington | 128 | 0,4 | N/A | |
| Common Good | Dick Rodgers | 121 | 0,3 | N/A | |
| Indépendant | Louise Cole | 91 | 0,3 | N/A | |
| Fur Play Party | Harry Bear | 73 | 0,2 | N/A | |
| Majorité | 10,116 | 29,1 | +1.6 | ||
| Participation | 34,761 | 50,5 | −17.4 | ||
| Conservateur hold | Swing | +0.8 | |||
| Parti | Candidat | Votes | % | ± | |
|---|---|---|---|---|---|
| Conservateur | Boris Johnson | 24,894 | 53,5 | ||
| Libéral Démocrate | David Turner | 12,101 | 26,0 | ||
| Travailliste | Kaleem Saeed | 6,862 | 14,7 | ||
| Green | Mark Stevenson | 1,518 | 3,3 | ||
| UKIP | Delphine Gray-Fisk | 1,162 | 2,5 | ||
| Majorité | 12,793 | 27,5 | |||
| Participation | 46,537 | 67,9 | |||
| Conservateur hold | Swing | ||||
| Parti | Candidat | Votes | % | ± | |
|---|---|---|---|---|---|
| Conservateur | Boris Johnson | 20,466 | 46,1 | ||
| Libéral Démocrate | Catherine Bearder | 12,008 | 27,0 | ||
| Travailliste | Janet Matthews | 9,367 | 21,1 | ||
| UKIP | Philip Collings | 1,413 | 3,2 | N/A | |
| Green | Oliver Tickell | 1,147 | 2,6 | ||
| Majorité | 8,458 | 19,1 | |||
| Participation | 44,401 | 64,3 | |||
| Conservateur hold | Swing | ||||
Élections dans les années 1990
| Parti | Candidat | Votes | % | ± | |
|---|---|---|---|---|---|
| Conservateur | Michael Heseltine | 23,908 | 46,4 | −13.3 | |
| Libéral Démocrate | Tim Horton | 12,741 | 24,7 | +0.6 | |
| Travailliste | Duncan Enright | 11,700 | 22,7 | +7.8 | |
| Référendum | Sebastian Sainsbury | 2,299 | 4,5 | N/A | |
| Green | Susan Miles | 514 | 1,0 | N/A | |
| Natural Law | Nigel Barlow | 221 | 0,4 | –0.1 | |
| Whig Party | Thomas Hibbert | 160 | 0,3 | N/A | |
| Majorité | 11,167 | 21,7 | −13.9 | ||
| Participation | 51,543 | 77,6 | −2.2 | ||
| Conservateur hold | Swing | -7.0 | |||
| Parti | Candidat | Votes | % | ± | |
|---|---|---|---|---|---|
| Conservateur | Michael Heseltine | 30,835 | 59,7 | −1.4 | |
| Libéral Démocrate | David G. Turner | 12,443 | 24,1 | −2.2 | |
| Travailliste | Ivan J. Russell-Swinnerton | 7,676 | 14,9 | +2.3 | |
| Indépendant | Alan S. Plane | 431 | 0,8 | +0.8 | |
| Natural Law | Sara A. Banerji | 274 | 0,5 | +0.5 | |
| Majorité | 18,392 | 35,6 | +0.8 | ||
| Participation | 51,659 | 79,8 | +4.9 | ||
| Conservateur hold | Swing | +0.4 | |||
Élections dans les années 1980
| Parti | Candidat | Votes | % | ± | |
|---|---|---|---|---|---|
| Conservateur | Michael Heseltine | 29,978 | 61,1 | +1.4 | |
| Liberal | John Madeley | 12,896 | 26,3 | -3.0 | |
| Travailliste | Michael Barber | 6,173 | 12,6 | +3.1 | |
| Majorité | 17,082 | 34,8 | +4.4 | ||
| Participation | 49,047 | 75,0 | +2.1 | ||
| Conservateur hold | Swing | ||||
| Parti | Candidat | Votes | % | ± | |
|---|---|---|---|---|---|
| Conservateur | Michael Heseltine | 27,039 | 59,7 | +1.0 | |
| Liberal | I. Brook | 13,258 | 29,3 | +6.4 | |
| Travailliste | I. Roxburgh | 4,282 | 9,5 | -9.0 | |
| Women for Life On Earth | R. Johnson | 517 | 1,1 | N/A | |
| One Nation Conservative | T. Rogers | 213 | 0,5 | N/A | |
| Majorité | 13,781 | 30,4 | -5.4 | ||
| Participation | 45,309 | 72,9 | -5.4 | ||
| Conservateur hold | Swing | ||||
Élections dans les années 1970
| Parti | Candidat | Votes | % | ± | |
|---|---|---|---|---|---|
| Conservateur | Michael Heseltine | 29,982 | 58,7 | +9.7 | |
| Liberal | Steve Atack | 11,693 | 22,9 | -3.9 | |
| Travailliste | D. J. Whiting | 9,435 | 18,5 | -5.8 | |
| Majorité | 18,289 | 35,8 | +13.6 | ||
| Participation | 77,5 | +4.0 | |||
| Conservateur hold | Swing | ||||
| Parti | Candidat | Votes | % | ± | |
|---|---|---|---|---|---|
| Conservateur | Michael Heseltine | 22,504 | 49,0 | ||
| Liberal | S. R. C. Evans | 12,288 | 26,8 | ||
| Travailliste | I. M. Haig | 11,141 | 24,3 | ||
| Majorité | 10,216 | 22,2 | |||
| Participation | 73,5 | ||||
| Conservateur hold | Swing | ||||
| Parti | Candidat | Votes | % | ± | |
|---|---|---|---|---|---|
| Conservateur | Michael Heseltine | 24,367 | 48,4 | ||
| Liberal | S. R. C. Evans | 15,467 | 30,7 | ||
| Travailliste | A. Alexander | 10,500 | 20,9 | ||
| Majorité | 8,900 | 17,7 | |||
| Participation | 81,3 | ||||
| Conservateur hold | Swing | ||||
| Parti | Candidat | Votes | % | ± | |
|---|---|---|---|---|---|
| Conservateur | John Hay | 33,452 | 53,4 | ||
| Travailliste | Maeve Judith Denby | 19,310 | 30,8 | ||
| Liberal | Arthur William Giles | 8,907 | 14,2 | N/A | |
| Anti-Common Market | Daniel Brunner | 960 | 1,5 | N/A | |
| Majorité | 14,142 | 22,6 | |||
| Participation | 74,0 | ||||
| Conservateur hold | Swing | ||||
Élections dans les années 1960
| Parti | Candidat | Votes | % | ± | |
|---|---|---|---|---|---|
| Conservateur | John Hay | 28,994 | 55,4 | ||
| Travailliste | George Cunningham | 23,320 | 44,6 | ||
| Majorité | 5,674 | 10,8 | |||
| Participation | 75,2 | ||||
| Conservateur hold | Swing | ||||
| Parti | Candidat | Votes | % | ± | |
|---|---|---|---|---|---|
| Conservateur | John Hay | 24,898 | 49,2 | ||
| Travailliste Co-op | Arthur Ledger | 16,614 | 32,8 | ||
| Liberal | Arthur William Giles | 9,081 | 18,0 | ||
| Majorité | 8,284 | 16,4 | |||
| Participation | 78,3 | ||||
| Conservateur hold | Swing | ||||
Élections dans les années 1950
| Parti | Candidat | Votes | % | ± | |
|---|---|---|---|---|---|
| Conservateur | John Hay | 24,417 | 53,4 | ||
| Travailliste Co-op | Arthur Ledger | 15,014 | 32,9 | ||
| Liberal | Charles Truman | 6,261 | 13,7 | N/A | |
| Majorité | 9,403 | 20,6 | |||
| Participation | 78,4 | ||||
| Conservateur hold | Swing | ||||
| Parti | Candidat | Votes | % | ± | |
|---|---|---|---|---|---|
| Conservateur | John Hay | 24,061 | 58,6 | ||
| Travailliste | Nora J T Wiles | 16,980 | 41,4 | ||
| Majorité | 7,081 | 17,3 | |||
| Participation | 75,4 | ||||
| Conservateur hold | Swing | ||||
| Parti | Candidat | Votes | % | ± | |
|---|---|---|---|---|---|
| Conservateur | John Hay | 23,621 | 58,0 | ||
| Travailliste | Constantine Gallop | 17,090 | 42,0 | ||
| Majorité | 6,531 | 16,0 | |||
| Participation | 78,3 | ||||
| Conservateur hold | Swing | ||||
| Parti | Candidat | Votes | % | ± | |
|---|---|---|---|---|---|
| Conservateur | John Hay | 20,488 | 49,4 | ||
| Travailliste | Alan Hawkins | 14,709 | 35,5 | ||
| Liberal | Peter Minoprio | 6,255 | 15,1 | ||
| Majorité | 5,779 | 13,9 | |||
| Participation | 81,7 | ||||
| Conservateur hold | Swing | ||||
Élections dans les années 1940
| Parti | Candidat | Votes | % | ± | |
|---|---|---|---|---|---|
| Conservateur | Gifford Fox | 22,286 | 42,5 | -27.9 | |
| Travailliste | James Stewart Cook | 19,457 | 37,1 | N/A | |
| Liberal | Lionel Brett | 10,718 | 20,4 | -9.2 | |
| Majorité | 2,829 | 5,4 | -35.4 | ||
| Participation | 52,461 | 66,3 | +9.4 | ||
| Conservateur hold | Swing | ||||
Élections dans les années 1930
| Parti | Candidat | Votes | % | ± | |
|---|---|---|---|---|---|
| Conservateur | Gifford Fox | 22,024 | 70,4 | +0.5 | |
| Liberal | John Herbert May | 9,254 | 29,6 | -0.5 | |
| Majorité | 12,770 | 40,8 | +1.0 | ||
| Participation | 31,278 | 56,9 | +8.0 | ||
| Conservateur hold | Swing | +1.0 | |||
| Parti | Candidat | Votes | % | ± | |
|---|---|---|---|---|---|
| Conservateur | Gifford Fox | 16,553 | 69,9 | -2.3 | |
| Liberal | Richard Matthews | 7,129 | 30,1 | +13.8 | |
| Majorité | 9,424 | 39,8 | -16.1 | ||
| Participation | 23,682 | 48,9 | -19.7 | ||
| Conservateur hold | Swing | -8.05 | |||
| Parti | Candidat | Votes | % | ± | |
|---|---|---|---|---|---|
| Conservateur | Robert Henderson | 24,015 | 72,2 | +20.3 | |
| Liberal | Richard Matthews | 5,411 | 16,3 | -13.6 | |
| Travailliste | Frederick J Hembury | 3,809 | 11,5 | -6.7 | |
| Majorité | 18,604 | 55,9 | +33.9 | ||
| Participation | 33,235 | 68,6 | -4.7 | ||
| Conservateur hold | Swing | +16.95 | |||
Élections dans les années 1920
| Parti | Candidat | Votes | % | ± | |
|---|---|---|---|---|---|
| Unioniste | Robert Henderson | 16,943 | 51,9 | −12.9 | |
| Liberal | Geoffrey Tritton | 9,786 | 29,9 | −5.3 | |
| Travailliste | Bernard Benjamin Gillis | 5,962 | 18,2 | N/A | |
| Majorité | 7,157 | 22,0 | −7.6 | ||
| Participation | 32,691 | 73,3 | +3.1 | ||
| Registre électeurs | 44,624 | ||||
| Unioniste hold | Swing | −3.8 | |||
| Parti | Candidat | Votes | % | ± | |
|---|---|---|---|---|---|
| Unioniste | Robert Henderson | 14,830 | 64,8 | +13.0 | |
| Liberal | Charles Alan Bennett | 8,060 | 35,2 | −13.0 | |
| Majorité | 6,770 | 29,6 | +26.0 | ||
| Participation | 22,890 | 70,2 | −3.1 | ||
| Registre électeurs | 32,613 | ||||
| Unioniste hold | Swing | +13.0 | |||
| Parti | Candidat | Votes | % | ± | |
|---|---|---|---|---|---|
| Unioniste | Reginald Terrell | 12,092 | 51,8 | −1.3 | |
| Liberal | R. Henry Rew | 11,266 | 48,2 | +1.3 | |
| Majorité | 826 | 3,6 | −2.6 | ||
| Participation | 23,358 | 73,3 | +3.7 | ||
| Registre électeurs | 31,873 | ||||
| Unioniste hold | Swing | −1.3 | |||
| Parti | Candidat | Votes | % | ± | |
|---|---|---|---|---|---|
| Unioniste | Reginald Terrell | 11,545 | 53,1 | −14.6 | |
| Liberal | R. Henry Rew | 10,204 | 46,9 | +14.6 | |
| Majorité | 1,341 | 6,2 | −29.2 | ||
| Participation | 21,749 | 69,6 | +17.4 | ||
| Registre électeurs | 31,246 | ||||
| Unioniste hold | Swing | −14.6 | |||
Élections dans les années 1910
| Parti | Candidat | Votes | % | ± | |
|---|---|---|---|---|---|
| C | Unioniste | Reginald Terrell | 10,757 | 67.7 | +8.6 |
| Liberal | Edmund Loftus MacNaghten | 5,138 | 32,3 | −8.6 | |
| Majorité | 5,619 | 35,4 | +17.2 | ||
| Participation | 15,895 | 52,2 | −33.6 | ||
| Registre électeurs | 30,457 | ||||
| Unioniste hold | Swing | +8.6 | |||
| C candidat approuvé par le gouvernement de coalition. | |||||
| Parti | Candidat | Votes | % | ± | |
|---|---|---|---|---|---|
| Unioniste | Robert Hermon-Hodge | Sans opposition | |||
| Unioniste hold | |||||
| Parti | Candidat | Votes | % | ± | |
|---|---|---|---|---|---|
| Conservateur | Valentine Fleming | 5,340 | 59,1 | +0.8 | |
| Liberal | G.C.N. Nicholson | 3,701 | 40,9 | −0.8 | |
| Majorité | 1,639 | 18,2 | +1.6 | ||
| Participation | 9,041 | 85,8 | −6.2 | ||
| Registre électeurs | 10,536 | ||||
| Conservateur hold | Swing | +0.8 | |||
| Parti | Candidat | Votes | % | ± | |
|---|---|---|---|---|---|
| Conservateur | Valentine Fleming | 5,649 | 58,3 | +11.3 | |
| Liberal | Philip Morrell | 4,046 | 41,7 | −11.3 | |
| Majorité | 1,603 | 16,6 | N/A | ||
| Participation | 9,695 | 92,0 | +4.4 | ||
| Registre électeurs | 10,536 | ||||
| Conservateur vainqueur sur Liberal | Swing | +11.3 | |||
Élections dans les années 1900
| Parti | Candidat | Votes | % | ± | |
|---|---|---|---|---|---|
| Liberal | Philip Morrell | 4,562 | 53,0 | +4.2 | |
| Conservateur | Robert Hermon-Hodge | 4,050 | 47,0 | −4.2 | |
| Majorité | 512 | 6,0 | N/A | ||
| Participation | 8,612 | 87,6 | +9.4 | ||
| Registre électeurs | 9,828 | ||||
| Liberal vainqueur sur Conservateur | Swing | +4.2 | |||
| Parti | Candidat | Votes | % | ± | |
|---|---|---|---|---|---|
| Conservateur | Robert Hermon-Hodge | 3,622 | 51,2 | −1.3 | |
| Liberal | H. L. Samuel | 3,450 | 48,8 | +1.3 | |
| Majorité | 172 | 2,4 | −2.6 | ||
| Participation | 7,072 | 78,2 | −3.5 | ||
| Registre électeurs | 9,039 | ||||
| Conservateur hold | Swing | −1.3 | |||
Élections dans les années 1890
| Parti | Candidat | Votes | % | ± | |
|---|---|---|---|---|---|
| Conservateur | Robert Hermon-Hodge | 3,831 | 52,5 | −0.5 | |
| Liberal | Herbert Samuel[39] | 3,470 | 47,5 | +0.5 | |
| Majorité | 361 | 5,0 | −1.0 | ||
| Participation | 7,301 | 81,7 | +2.0 | ||
| Registre électeurs | 8,932 | ||||
| Conservateur hold | Swing | −0.5 | |||
| Parti | Candidat | Votes | % | ± | |
|---|---|---|---|---|---|
| Conservateur | Francis Parker | 3,688 | 53,0 | −5.6 | |
| Liberal | Walter Phillimore | 3,269 | 47,0 | +5.6 | |
| Majorité | 419 | 6,0 | −11.2 | ||
| Participation | 6,957 | 79,7 | +6.4 | ||
| Registre électeurs | 8,731 | ||||
| Conservateur hold | Swing | −5.6 | |||
Élections dans les années 1880
| Parti | Candidat | Votes | % | ± | |
|---|---|---|---|---|---|
| Conservateur | Francis Parker | 3,674 | 58,6 | +4.9 | |
| Liberal | Walter Phillimore | 2,600 | 41,4 | −4.9 | |
| Majorité | 1,074 | 17,2 | +9.8 | ||
| Participation | 6,274 | 73,3 | −8.9 | ||
| Registre électeurs | 8,555 | ||||
| Conservateur hold | Swing | +4.9 | |||
| Parti | Candidat | Votes | % | ± | |
|---|---|---|---|---|---|
| Conservateur | Edward Vernon Harcourt | 3,778 | 53,7 | N/A | |
| Liberal | Frederick William Maude[40] | 3,258 | 46,3 | N/A | |
| Majorité | 520 | 7,4 | N/A | ||
| Participation | 7,036 | 82,2 | N/A | ||
| Registre électeurs | 8,555 | ||||
| Conservateur vainqueur (nouveau siège) | |||||
Références
- (en) Cet article est partiellement ou en totalité issu de l’article de Wikipédia en anglais intitulé « Henley (UK Parliament constituency) » (voir la liste des auteurs).
- « Electorate Figures – Boundary Commission for England » [archive du ], sur 2011 Electorate Figures, Boundary Commission for England, (consulté le )
- Leigh Rayment's Historical List of MPs – Constituencies beginning with "A" (part 1)
- http://www.southoxon.gov.uk/sites/default/files/Statement%20of%20Person%20Nominated%20and%20Notice%20of%20Poll%20-%20Henley.pdf
- « Declaration of Results of Poll - South Oxfordshire Election of a Member of Parliament for Henley »
- « Election Data 2015 » [archive du ], Electoral Calculus (consulté le )
- « UK ELECTION RESULTS: HENLEY 2015 »
- « Sam Juthani Labour », (version du 13 février 2015 sur Internet Archive)
- « Sue Cooper PPC page », Liberal Democrats (consulté le )
- « constituencies » [archive du ], UKIP South East (consulté le )
- « Mark Stevenson is the Green Party parliamentary candidate for Henley », sur Oxfordshire Green Party
- « Election Data 2010 » [archive du ], Electoral Calculus (consulté le )
- « BBC NEWS – Election 2010 – Henley », BBC News
- « UKPollingReport Election Guide 2010 » Henley »
- « Election Data 2005 » [archive du ], Electoral Calculus (consulté le )
- Ask Aristotle: Henley, guardian.co.uk
- « Election Data 2001 » [archive du ], Electoral Calculus (consulté le )
- « Election Data 1997 » [archive du ], Electoral Calculus (consulté le )
- « Election Data 1992 » [archive du ], Electoral Calculus (consulté le )
- « Politics Resources » [archive du ], sur Election 1992, Politics Resources, (consulté le )
- « Election Data 1987 » [archive du ], Electoral Calculus (consulté le )
- UK General Election results June 1987
- « Election Data 1983 » [archive du ], Electoral Calculus (consulté le )
- UK General Election results June 1983
- UK General Election results May 1979
- UK General Election results October 1974
- UK General Election results February 1974
- UK General Election results 1970
- UK General Election results March 1966
- UK General Election results October 1964
- UK General Election results October 1959
- UK General Election results May 1955
- UK General Election results October 1951
- UK General Election results February 1950
- UK General Election results July 1945
- F. W. S. Craig, British Parliamentary Election Results 1918 – 1949
- British Parliamentary Election Results: 1885-1918, London, Macmillan Press, (ISBN 9781349022984)
- « South Oxfordshire Election », Reading Mercury, , p. 7 (lire en ligne
 , consulté le )
 - « The Representation of Oxfordshire », Oxford Journal, , p. 8 (lire en ligne
 , consulté le )
Sources
- The Times House of Commons 1929, 1931, 1935, Politico's (reprint), (ISBN 1-84275-033-X)
- The Times House of Commons 1945,
- The Times House of Commons 1950,
- The Times House of Commons 1955,
Articles connexes
Cet article est issu de wikipedia. Text licence: CC BY-SA 4.0, Des conditions supplémentaires peuvent s’appliquer aux fichiers multimédias.