Eastbourne (circonscription du Parlement britannique)
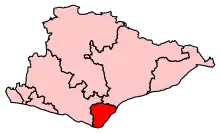
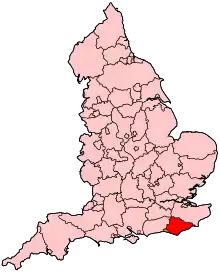
La circonscription d'Eastbourne est une circonscription parlementaire britannique. Située dans l'East Sussex, elle comprend l'intégralité du borough d'Eastbourne.
Circonscription parlementaire de la Chambre des Communes
| Comté | East Sussex |
|---|---|
| Électeurs inscrits | 78,262 (Mai 2015[1]) |
| Villes principales | Eastbourne |
| Création | 1885 |
|---|---|
| Member of Parliament |
Caroline Ansell (Conservateur) |
| Créé à partir de | East Sussex |
| Parlement européen | Angleterre du Sud-Est |
|---|
Créée en 1885 à partir de l'ancienne circonscription d'East Sussex, elle est représentée à la Chambre des communes du Parlement britannique.
Members of Parliament
| Élection | Membre[2] | Parti | ||
|---|---|---|---|---|
| 1885 | Edward Field |  |
Conservateur | |
| 1900 | Sir Lindsay Hogg | Conservateur | ||
| 1906 | Hubert Beaumont | Libéral | ||
| Jan 1910 | Rupert Gwynne | Conservateur | ||
| 1924 | Sir George Lloyd |  |
Conservateur | |
| Élection partielle 1925 | Sir Reginald Hall |  |
Conservateur | |
| 1929 | Edward Marjoribanks | Conservateur | ||
| Élection partielle 1932 | John Slater | Conservateur | ||
| Élection partielle 1935 | Sir Charles Taylor | Conservateur | ||
| Fév 1974 | Ian Gow | Conservateur | ||
| Élection partielle 1990 | David Bellotti | Libéral Démocrates | ||
| 1992 | Nigel Waterson | Conservateur | ||
| 2010 | Stephen Lloyd |  |
Libéral Démocrates | |
| 2015 | Caroline Ansell |  |
Conservateur | |
| 2017 | Stephen Lloyd | |
Libéral Démocrates | |
| 2018 | Indépendant | |||
| 2019 | Libéral Démocrates | |||
| 2019 | Caroline Ansell | |
Conservateur | |
Élections
Élections dans les années 2010
| Parti | Candidat | Votes | % | ± | |
|---|---|---|---|---|---|
| Conservateur | Caroline Ansell | 26,951 | 48,9 | ||
| Libéral Démocrate | Stephen Lloyd | 22,620 | 41,0 | ||
| Travailliste | Jake Lambert | 3,848 | 7,0 | ||
| Brexit | Stephen Gander | 1,530 | 2,8 | New | |
| Indépendant | Ken Pollock | 185 | 0,3 | New | |
| Majorité | 4,331 | 7,9 | N/A | ||
| Participation | 55,134 | 69,5 | |||
| Conservateur vainqueur sur Libéral Démocrate | Swing | ||||
| Parti | Candidat | Votes | % | ± | |
|---|---|---|---|---|---|
| Libéral Démocrate | Stephen Lloyd | 26,924 | 46,9 | ||
| Conservateur | Caroline Ansell | 25,315 | 44,1 | ||
| Travailliste | Jake Lambert | 4,671 | 8,1 | ||
| Green | Alex Hough | 510 | 0,9 | ||
| Majorité | 1,609 | 2,8 | N/A | ||
| Participation | 57,420 | 72,9 | |||
| Libéral Démocrate vainqueur sur Conservateur | Swing | ||||
| Parti | Candidat | Votes | % | ± | |
|---|---|---|---|---|---|
| Conservateur | Caroline Ansell | 20,934 | 39,6 | ||
| Libéral Démocrate | Stephen Lloyd | 20,201 | 38,2 | ||
| UKIP | Nigel Jones | 6,139 | 11,6 | ||
| Travailliste | Jake Lambert | 4,143 | 7,8 | ||
| Green | Andrew Durling | 1,351 | 2,6 | N/A | |
| Indépendant | Paul Howard | 139 | 0,3 | N/A | |
| Majorité | 733 | 1,4 | N/A | ||
| Participation | 52,907 | 67,6 | |||
| Conservateur vainqueur sur Libéral Démocrate | Swing | ||||
| Parti | Candidat | Votes | % | ± | |
|---|---|---|---|---|---|
| Libéral Démocrate | Stephen Lloyd | 24,658 | 47,3 | ||
| Conservateur | Nigel Waterson | 21,223 | 40,7 | ||
| Travailliste | Dave Brinson | 2,497 | 4,8 | ||
| Indépendant | Stephen Shing | 1,327 | 2,5 | N/A | |
| UKIP | Roger Needham | 1,305 | 2,5 | ||
| BNP | Colin Poulter | 939 | 1,8 | N/A | |
| Indépendant | Michael Baldry | 101 | 0,2 | N/A | |
| Indépendant | Keith Gell | 74 | 0,1 | N/A | |
| Majorité | 3,435 | 6,6 | |||
| Participation | 52,124 | 67,0 | |||
| Libéral Démocrate vainqueur sur Conservateur | Swing | ||||
Élections dans les années 2000
| Parti | Candidat | Votes | % | ± | |
|---|---|---|---|---|---|
| Conservateur | Nigel Waterson | 21,033 | 43,5 | −0.6 | |
| Libéral Démocrate | Stephen Lloyd | 19,909 | 41,1 | +1.8 | |
| Travailliste | Andrew Jones | 5,268 | 10,9 | −2.4 | |
| UKIP | Andrew Meggs | 1,233 | 2,5 | +0.5 | |
| Green | Clive Gross | 949 | 2,0 | N/A | |
| Majorité | 1,124 | 2,4 | -2.4 | ||
| Participation | 48,392 | 64,8 | +5.2 | ||
| Conservateur hold | Swing | -1.2 | |||
| Parti | Candidat | Votes | % | ± | |
|---|---|---|---|---|---|
| Conservateur | Nigel Waterson | 19,738 | 44,1 | +2.0 | |
| Libéral Démocrate | Chris Berry | 17,584 | 39,3 | +0.9 | |
| Travailliste | Gillian Roles | 5,967 | 13,3 | +0.8 | |
| UKIP | Barry Jones | 907 | 2,0 | +1.5 | |
| Libéral | Theresia Williamson | 574 | 1,3 | −0.1 | |
| Majorité | 2,154 | 4,8 | +1.0 | ||
| Participation | 44,770 | 59,6 | −13.2 | ||
| Conservateur hold | Swing | +1.5 | |||
Élections dans les années 1990
| Parti | Candidat | Votes | % | ± | |
|---|---|---|---|---|---|
| Conservateur | Nigel Waterson | 22,183 | 42,1 | −10.9 | |
| Libéral Démocrate | Chris Berry | 20,189 | 38,3 | −2.9 | |
| Travailliste | David Lines | 6,576 | 12,5 | +7.8 | |
| Référendum | Trevor Lowe | 2,724 | 5,2 | N/A | |
| Libéral | Theresia Williamson | 741 | 1,4 | ||
| Natural Law | John Dawkins | 254 | 0,5 | N/A | |
| Majorité | 1,994 | 3,8 | -5.1 | ||
| Participation | 52,667 | 72,8 | -8.1 | ||
| Conservateur hold | Swing | -6.9 | |||
Cette circonscription a subi des changements de limites entre les élections générales de 1992 et 1997 et, par conséquent, la variation de la part des voix est basée sur un calcul théorique.
| Parti | Candidat | Votes | % | ± | |
|---|---|---|---|---|---|
| Conservateur | Nigel Waterson | 31,792 | 51,6 | −8.3 | |
| Libéral Démocrate | David Bellotti | 26,311 | 42,7 | +13.0 | |
| Travailliste | Ivan A. Gibbons | 2,834 | 4,6 | −4.2 | |
| Green | David Aherne | 391 | 0,6 | −0.9 | |
| Libéral | MT Williamson | 296 | 0,5 | −29.3 | |
| Majorité | 5,481 | 8,9 | −21.3 | ||
| Participation | 61,624 | 80,9 | +5.3 | ||
| Conservateur hold | Swing | −10.7 | |||
| Parti | Candidat | Votes | % | ± | |
|---|---|---|---|---|---|
| Libéral Démocrate | David Bellotti | 23,415 | 50,8 | +21.1 | |
| Conservateur | Richard Hickmet | 18,865 | 41,0 | -18.9 | |
| Travailliste | Charlotte Atkins | 2,308 | 5,0 | -3.8 | |
| Green | David Aherne | 553 | 1,2 | -0.4 | |
| Libéral | Theresia Williamson | 526 | 1,1 | N/A | |
| Corrective Party | Lady Whiplash | 216 | 0,5 | N/A | |
| National Front | John McAuley | 154 | 0,3 | N/A | |
| Ironside Party | Eric Page | 35 | 0,1 | N/A | |
| Majorité | 4,550 | 9,8 | N/A | ||
| Participation | 46,072 | 60,7 | -14.9 | ||
| Libéral Démocrate vainqueur sur Conservateur | Swing | +20.0 | |||
Élections dans les années 1980
| Parti | Candidat | Votes | % | ± | |
|---|---|---|---|---|---|
| Conservateur | Ian Gow | 33,587 | 59,9 | +0.8 | |
| Liberal | Peter Driver | 16,664 | 29,7 | -4.1 | |
| Travailliste | Ash Patel | 4,928 | 8,8 | +1.7 | |
| Green | Ruth Addison | 867 | 1,6 | N/A | |
| Majorité | 16,923 | 30,2 | +4.9 | ||
| Participation | 56,046 | 75,6 | +2.6 | ||
| Conservateur hold | Swing | +2.5 | |||
| Parti | Candidat | Votes | % | ± | |
|---|---|---|---|---|---|
| Conservateur | Ian Gow | 31,501 | 59,1 | -3.9 | |
| Liberal | Peter Driver | 18,015 | 33,8 | +15.0 | |
| Travailliste | Charles Clark | 3,790 | 7,1 | -10.1 | |
| Majorité | 13,486 | 25,3 | -18.9 | ||
| Participation | 53,306 | 73,0 | -3.7 | ||
| Conservateur hold | Swing | -9.5 | |||
Élections dans les années 1970
| Parti | Candidat | Votes | % | ± | |
|---|---|---|---|---|---|
| Conservateur | Ian Gow | 37,168 | 63,1 | +8.4 | |
| Liberal | David Bellotti | 11,084 | 18,8 | -7.1 | |
| Travailliste | Len Caine | 10,166 | 17,2 | -2.3 | |
| National Front | C Mitchell | 533 | 0,9 | N/A | |
| Majorité | 26,084 | 44,25 | |||
| Participation | 58,951 | 76,68 | |||
| Conservateur hold | Swing | +7.8 | |||
| Parti | Candidat | Votes | % | ± | |
|---|---|---|---|---|---|
| Conservateur | Ian Gow | 30,442 | 54,7 | +3.6 | |
| Liberal | Gurth Hoyer-Millar | 14,417 | 25,9 | -13.2 | |
| Travailliste | Len Caine | 10,830 | 19,5 | +9.9 | |
| Majorité | 16,025 | 28,78 | |||
| Participation | 55,689 | 74,55 | |||
| Conservateur hold | Swing | +8.4 | |||
| Parti | Candidat | Votes | % | ± | |
|---|---|---|---|---|---|
| Conservateur | Ian Gow | 31,462 | 51,3 | ' | |
| Liberal | Stephen Terrell | 23,987 | 39,1 | ||
| Travailliste | David Dawson | 5,874 | 9,6 | ||
| Majorité | 7,475 | 12,19 | |||
| Participation | 61,323 | 82,60 | |||
| Conservateur hold | Swing | ||||
| Parti | Candidat | Votes | % | ± | |
|---|---|---|---|---|---|
| Conservateur | Charles Taylor | 30,296 | 48,8 | ' | |
| Liberal | Stephen Terrell | 23,308 | 37,6 | ||
| Travailliste | Cyril George Abley | 8,475 | 13,7 | ||
| Majorité | 6,988 | 11,26 | |||
| Participation | 62,079 | 73,67 | |||
| Conservateur hold | Swing | - | |||
Élections dans les années 1960
| Parti | Candidat | Votes | % | ± | |
|---|---|---|---|---|---|
| Conservateur | Charles Taylor | 26,039 | 46,26 | ' | |
| Liberal | Stephen Terrell | 16,746 | 29,75 | ||
| Travailliste | John Harold High | 12,620 | 22,42 | ||
| Indépendant | Vernon Hubert Petty | 883 | 1,57 | ||
| Majorité | 9,293 | 16,51 | |||
| Participation | 56,288 | 77,24 | |||
| Conservateur hold | Swing | ||||
| Parti | Candidat | Votes | % | ± | |
|---|---|---|---|---|---|
| Conservateur | Charles Taylor | 26,410 | 49,01 | ' | |
| Liberal | Stephen Terrell | 15,441 | 28,66 | ||
| Travailliste Co-op | Joan E. M. Baker | 12,034 | 22,33 | ||
| Majorité | 10,969 | 20,36 | |||
| Participation | 53,885 | 76,70 | |||
| Conservateur hold | Swing | ||||
Élections dans les années 1950
| Parti | Candidat | Votes | % | ± | |
|---|---|---|---|---|---|
| Conservateur | Charles Taylor | 27,874 | 57,28 | ' | |
| Travailliste | Anthony Albert Dumont | 11,837 | 24,32 | ||
| Liberal | Ronald Gardner-Thorpe | 8,955 | 18,40 | ||
| Majorité | 16,037 | 32,95 | |||
| Participation | 48,666 | 77,28 | |||
| Conservateur hold | Swing | ||||
| Parti | Candidat | Votes | % | ± | |
|---|---|---|---|---|---|
| Conservateur | Charles Taylor | 29,779 | 65,68 | ' | |
| Travailliste | John A. Lewis | 15,561 | 34,32 | ||
| Majorité | 14,218 | 31,36 | |||
| Participation | 75,81 | ||||
| Conservateur hold | Swing | ||||
| Parti | Candidat | Votes | % | ± | |
|---|---|---|---|---|---|
| Conservateur | Charles Taylor | 39,278 | 67,15 | ' | |
| Travailliste | Christopher Attlee | 19,217 | 32,85 | ||
| Majorité | 20,061 | 34,30 | |||
| Participation | 81,93 | ||||
| Conservateur hold | Swing | ||||
| Parti | Candidat | Votes | % | ± | |
|---|---|---|---|---|---|
| Conservateur | Charles Taylor | 35,425 | 59,54 | ' | |
| Travailliste | Reginald Groves | 18,304 | 30,77 | ||
| Liberal | Cecil Bate | 5,766 | 9,69 | ||
| Majorité | 17,121 | 28,78 | |||
| Participation | 85,08 | ||||
| Conservateur hold | Swing | ||||
Élections dans les années 1940
| Parti | Candidat | Votes | % | ± | |
|---|---|---|---|---|---|
| Conservateur | Charles Taylor | 18,173 | 53,24 | ' | |
| Travailliste | Duncan Newman Smith | 12,637 | 37,02 | ||
| Liberal | John Stafford Gowland | 2,797 | 8,19 | ||
| Independent National | Reg Hipwell | 524 | 1,54 | ||
| Majorité | 5,536 | 16,22 | |||
| Participation | 77,35 | ||||
| Conservateur hold | |||||
Élections dans les années 1930
| Parti | Candidat | Votes | % | ± | |
|---|---|---|---|---|---|
| Conservateur | Charles Taylor | Sans opposition | |||
| Conservateur hold | |||||
| Parti | Candidat | Votes | % | ± | |
|---|---|---|---|---|---|
| Conservateur | Charles Taylor | Sans opposition | |||
| Conservateur hold | |||||
| Parti | Candidat | Votes | % | ± | |
|---|---|---|---|---|---|
| Conservateur | John Slater | Sans opposition | |||
| Conservateur hold | |||||
| Parti | Candidat | Votes | % | ± | |
|---|---|---|---|---|---|
| Conservateur | Edward Marjoribanks | 31,240 | 85,31 | ' | |
| Travailliste | A.J. Marshall | 5,379 | 14,69 | ||
| Majorité | 25,861 | 70,62 | |||
| Participation | 71,86 | ||||
| Conservateur hold | Swing | ||||
Élections dans les années 1920
| Parti | Candidat | Votes | % | ± | |
|---|---|---|---|---|---|
| Unioniste | Edward Marjoribanks | 18,157 | 49,9 | -8.5 | |
| Travailliste | R S Chatfield | 8,204 | 22,5 | +5.6 | |
| Liberal | Clive Stuart Saxon Burt | 7,812 | 21,4 | -3.3 | |
| Independent Unionist | P E Hurst | 2,277 | 6,2 | n/a | |
| Majorité | 9,953 | 27,4 | -6.3 | ||
| Participation | 36,450 | 74,5 | |||
| Unioniste hold | Swing | -7.0 | |||
| Parti | Candidat | Votes | % | ± | |
|---|---|---|---|---|---|
| Unioniste | Reginald Hall | 12,741 | 58,4 | -9.5 | |
| Liberal | Harcourt Johnstone | 5,386 | 24,7 | +8.6 | |
| Travailliste | Thomas Williams | 3,696 | 16,9 | +0.9 | |
| Majorité | 7,355 | 33,7 | -18.1 | ||
| Participation | 21,823 | 60,7 | -14.9 | ||
| Unioniste hold | Swing | -9.0 | |||
| Parti | Candidat | Votes | % | ± | |
|---|---|---|---|---|---|
| Unioniste | George Lloyd | 17,533 | 67,9 | +14.1 | |
| Liberal | J J Davies | 4,168 | 16,1 | -30.1 | |
| Travailliste | D J Davis | 4,138 | 16,0 | n/a | |
| Majorité | 13,365 | 51,8 | +44.2 | ||
| Participation | 25,839 | 77,6 | |||
| Unioniste hold | Swing | +22.1 | |||
| Parti | Candidat | Votes | % | ± | |
|---|---|---|---|---|---|
| Unioniste | Rupert Gwynne | 13,276 | 53,8 | -6.7 | |
| Liberal | Thomas Wiles | 11,396 | 46,2 | +6.7 | |
| Majorité | 1,880 | 7,6 | -13.4 | ||
| Participation | 77,0 | ||||
| Unioniste hold | Swing | -6.7 | |||
| Parti | Candidat | Votes | % | ± | |
|---|---|---|---|---|---|
| Unioniste | Rupert Gwynne | 14,601 | 60,5 | -3.1 | |
| Liberal | Edward Duke | 9,550 | 39,5 | +29.1 | |
| Majorité | 5,051 | 21,0 | -16.6 | ||
| Participation | 77,2 | ||||
| Unioniste hold | Swing | -16.1 | |||
Élections dans les années 1910
| Parti | Candidat | Votes | % | ± | |
|---|---|---|---|---|---|
| C | Unioniste | Rupert Gwynne | 11,357 | 63.6 | +5.3 |
| Travailliste | Thomas Burleigh Hasdell | 4,641 | 26,0 | N/A | |
| Liberal | Alfred John Callaghan | 1,852 | 10,4 | −31.3 | |
| Majorité | 6,716 | 37,6 | +21.0 | ||
| Participation | 17,850 | 59,8 | −23.4 | ||
| Unioniste hold | Swing | +18.3 | |||
| C candidat approuvé par le gouvernement de coalition. | |||||
Élection générale 1914/15:
Une autre élection générale devait avoir lieu avant la fin de 1915. Les partis politiques préparaient une élection et en juillet 1914, les candidats suivants avaient été sélectionnés;
- Unioniste: Rupert Gwynne
- Libéral:
| Parti | Candidat | Votes | % | ± | |
|---|---|---|---|---|---|
| Conservateur | Rupert Gwynne | 6,873 | 58,3 | −0.7 | |
| Liberal | Hector Morison | 4,920 | 41,7 | +0.7 | |
| Majorité | 1,953 | 16,6 | −1.4 | ||
| Participation | 11,793 | 83,2 | −7.1 | ||
| Registre électeurs | 14,172 | ||||
| Conservateur hold | Swing | −0.7 | |||
| Parti | Candidat | Votes | % | ± | |
|---|---|---|---|---|---|
| Conservateur | Rupert Gwynne | 7,553 | 59,0 | +11.8 | |
| Liberal | Hector Morison | 5,249 | 41,0 | −11.8 | |
| Majorité | 2,304 | 18,0 | N/A | ||
| Participation | 12,802 | 90,3 | +3.3 | ||
| Registre électeurs | 14,172 | ||||
| Conservateur vainqueur sur Liberal | Swing | +11.8 | |||
Élections dans les années 1900
| Parti | Candidat | Votes | % | ± | |
|---|---|---|---|---|---|
| Liberal | Hubert Beaumont | 5,933 | 52,8 | +6.6 | |
| Conservateur | Lindsay Hogg | 5,303 | 47,2 | -6.6 | |
| Majorité | 630 | 5,6 | N/A | ||
| Participation | 11,236 | 87,0 | +5.2 | ||
| Registre électeurs | 12,913 | ||||
| Liberal vainqueur sur Conservateur | Swing | +6.6 | |||
| Parti | Candidat | Votes | % | ± | |
|---|---|---|---|---|---|
| Conservateur | Lindsay Hogg | 4,948 | 53,8 | +3.4 | |
| Liberal | Thomas Seymour Brand | 4,254 | 46,2 | −3.4 | |
| Majorité | 694 | 7,6 | +6.8 | ||
| Participation | 9,202 | 81,8 | +4.0 | ||
| Registre électeurs | 11,248 | ||||
| Conservateur hold | Swing | +3.4 | |||
Élections dans les années 1890
| Parti | Candidat | Votes | % | ± | |
|---|---|---|---|---|---|
| Conservateur | Edward Field | 4,139 | 50,4 | −2.0 | |
| Liberal | Thomas Seymour Brand | 4,079 | 49,6 | +2.0 | |
| Majorité | 60 | 0,8 | −4.0 | ||
| Participation | 8,218 | 77,8 | +0.9 | ||
| Registre électeurs | 10,563 | ||||
| Conservateur hold | Swing | −2.0 | |||
| Parti | Candidat | Votes | % | ± | |
|---|---|---|---|---|---|
| Conservateur | Edward Field | 4,037 | 52,4 | −7.7 | |
| Liberal | Thomas Seymour Brand | 3,674 | 47,6 | +7.7 | |
| Majorité | 363 | 4,8 | −15.4 | ||
| Participation | 7,711 | 76,9 | +3.3 | ||
| Registre électeurs | 10,029 | ||||
| Conservateur hold | Swing | −7.7 | |||
Élections dans les années 1880
| Parti | Candidat | Votes | % | ± | |
|---|---|---|---|---|---|
| Conservateur | Edward Field | 3,760 | 60,1 | +9.6 | |
| Liberal | James Clifton Brown[25] | 2,501 | 39,9 | −9.6 | |
| Majorité | 1,259 | 20,2 | +19.2 | ||
| Participation | 6,261 | 73,6 | −9.4 | ||
| Registre électeurs | 8,504 | ||||
| Conservateur hold | Swing | +9.6 | |||
| Parti | Candidat | Votes | % | ± | |
|---|---|---|---|---|---|
| Conservateur | Edward Field | 3,561 | 50,5 | N/A | |
| Liberal | George Ambrose Wallis | 3,497 | 49,5 | N/A | |
| Majorité | 64 | 1,0 | N/A | ||
| Participation | 7,058 | 83,0 | N/A | ||
| Registre électeurs | 8,504 | ||||
| Conservateur vainqueur (nouveau siège) | |||||
Références
- (en) Cet article est partiellement ou en totalité issu de l’article de Wikipédia en anglais intitulé « Eastbourne (UK Parliament constituency) » (voir la liste des auteurs).
- « Eastbourne – Election Results », House of Commons Library, (consulté le )
- Leigh Rayment's Historical List of MPs – Constituencies beginning with "A" (part 1)
- https://www.lewes-eastbourne.gov.uk/_resources/assets/inline/full/0/284812.pdf
- « The Conservative candidates running to be MPs »,
- http://www.libdems.org.uk/, « Stephen Lloyd »,
- « BBC Election Results », (consulté le )
- « Election Data 2015 » [archive du ], Electoral Calculus (consulté le )
- « Eastbourne parliamentary constituency – Election 2017 »
- « Election Data 2010 » [archive du ], Electoral Calculus (consulté le )
- « Eastborne election results », BBC, (consulté le )
- « Election Data 2005 » [archive du ], Electoral Calculus (consulté le )
- « Election Data 2001 » [archive du ], Electoral Calculus (consulté le )
- « Election Data 1997 » [archive du ], Electoral Calculus (consulté le )
- « Election Data 1992 » [archive du ], Electoral Calculus (consulté le )
- « Politics Resources » [archive du ], sur Election 1992, Politics Resources, (consulté le )
- « Election Data 1987 » [archive du ], Electoral Calculus (consulté le )
- « Election Data 1983 » [archive du ], Electoral Calculus (consulté le )
- F W S Craig, British Parliamentary Election Results 1918–1949; Political Reference Publications, Glasgow 1949
- Craig, F. W. S. (1983). British parliamentary election results 1918–1949 (3 ed.). Chichester: Parliamentary Research Services. (ISBN 0-900178-06-X).
- Debrett's House of Commons & Judicial Bench, 1916
- British Parliamentary Election Results: 1885-1918, London, Macmillan Press, (ISBN 9781349022984)
- The Liberal Year Book, 1907
- Debrett's House of Commons & Judicial Bench, 1901
- « Meeting of the Council », Eastbourne Gazette, , p. 8 (lire en ligne
 , consulté le )
 - Debrett's House of Commons & Judicial Bench, 1886
Sources
- Résultats élections, 2005 (BBC)
- Résultats élections, 1997–2001 (BBC)
- Résultats élections, 1997–2001 (Election Demon)
- Résultats élections, 1983–1992
- Résultats élections, 1992–2005 (Guardian)
- Résultats élections, 1950–2001 (Keele University)
- The Times House of Commons 1945, The Times,
- The Times House of Commons 1929, 1931, 1935, Politico's (reprint), (ISBN 1-84275-033-X)
- F. W. S. Craig, British parliamentary election results 1918–1949, Chichester, Parliamentary Research Services, (1re éd. 1969) (ISBN 0-900178-06-X)