Résultats par ville
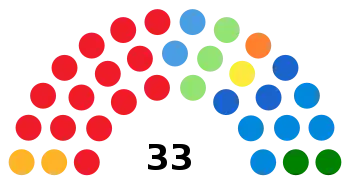
Le démocrate Emilio Del Bono défait au second tour le maire sortant Adriano Paroli (PdL). Le Centre-gauche reprend la mairie de Brescia. À noter que la candidate Laura Castelletti a donné son appui à Emilio Del Bono en vue du second tour.
← Résultats des Élections municipales de 2013 à Brescia[6] →
  |
| Mairie |
Conseil |
Total |
| 1er tour |
2e tour |
| Candidats |
Votes |
% |
Votes |
% |
Élus |
Partis |
Votes |
% |
+/- |
Sièges |
+/- |
|
Emilio Del Bono |
34 373 |
38,07 |
46 850 |
56,53 |
1 |
|
Parti démocrate |
21 254 |
27,38 |
 0,5 0,5 |
13 |
2 |
|
|
Del Bono pour la mairie |
4 095 |
5,28 |
Nv. |
2 |
 2 2 |
|
Brescia au travail (SEL) |
3 564 |
4,59 |
Nv. |
2 |
2 |
|
Avec les gens |
551 |
0,71 |
Nv. |
— |
 |
|
Écologistes et réseaux civiques |
489 |
0,63 |
0,4 |
— |
|
|
Esprits libres (PSI) |
464 |
0,60 |
Nv. |
— |
|
| Total Centre-gauche |
30 417 |
39,19 |
2,4 |
17 |
6 |
18 |
|
Adriano Paroli |
34 323 |
38,01 |
36 027 |
43,47 |
1 |
|
Le Peuple de la liberté |
11 180 |
14,40 |
13,9 |
4 |
10 |
|
|
Liste Paroli (SC) |
7 463 |
9,62 |
Nv. |
3 |
3 |
|
Ligue |
6 724 |
8,66 |
7,2 |
2 |
6 |
|
Frères d'Italie |
2 132 |
2,75 |
Nv. |
— |
|
|
Union de centre |
1 942 |
2,50 |
1,4 |
— |
2 |
|
Parti des retraités |
458 |
0,59 |
0,4 |
— |
|
|
Brescia du futur |
286 |
0,37 |
Nv. |
— |
|
|
Volontaires pour tous |
285 |
0,37 |
Nv. |
— |
|
|
Parti libéral italien |
183 |
0,24 |
Nv. |
— |
|
| Total Centre-droit |
30 653 |
39,49 |
10,9 |
9 |
15 |
10 |
|
Francesco Onofri |
6 711 |
7,43 |
|
1 |
|
Liste Onofri |
2 378 |
3,06 |
0,3 |
— |
|
|
|
Plate-forme civique |
1 663 |
2,14 |
Nv. |
— |
|
|
Brescia civique |
863 |
1,11 |
Nv. |
— |
|
| Total Onofri pour la mairie |
4 904 |
6,32 |
Nv. |
— |
|
1 |
|
Laura Gamba |
6 588 |
7,30 |
|
1 |
|
Mouvement 5 étoiles |
5 238 |
6,75 |
Nv. |
— |
|
1 |
|
Laura Castelletti |
6 247 |
6,92 |
|
1 |
|
Brescia 2013 |
4 555 |
5,87 |
0,4 |
2 |
1 |
3 |
|
Pierantonio Penocchio |
610 |
0,68 |
|
— |
|
Forza Nuova |
540 |
0,70 |
0,1 |
— |
|
0 |
|
Fiorenzo Bertocchi |
590 |
0,65 |
|
— |
|
Parti de la refondation communiste |
581 |
0,75 |
0,8 |
— |
|
0 |
|
Giovanna Giacopini |
520 |
0,58 |
|
— |
|
Brescia solidaire et libertaire |
447 |
0,58 |
Nv. |
— |
|
0 |
|
Anna Seniga |
230 |
0,25 |
|
— |
|
Femmes pour Brescia |
195 |
0,25 |
Nv. |
— |
|
0 |
|
Alberto Prandini |
107 |
0,12 |
|
— |
|
Parti Italie nouvelle |
84 |
0,11 |
Nv. |
— |
|
0 |
|
|
| Votes valides |
90 300 |
97,15 |
82 877 |
98,61 |
|
Votes valides |
77 614 |
83,50 |
|
| Votes blancs et nuls |
2 650 |
2,85 |
1 171 |
1,39 |
Votes blancs et nuls |
15 336 |
16,50 |
| Total candidats |
92 950 |
100 |
84 048 |
100 |
5 |
Total partis |
92 950 |
100 |
- |
28 |
7 |
33 |
| Abstentions |
48 845 |
34,45 |
57 747 |
40,73 |
|
Abstentions |
48 845 |
34,45 |
|
| Inscrits/participation |
141 795 |
65,55 |
141 795 |
59,27 |
Inscrits/participation |
141 795 |
65,55 |
|
Vote populaire
Résultats classés par listes
| Partis |
Votes |
% |
+/- |
S. |
+/- |
Coalition |
|---|
|
Parti démocrate |
21 254 |
27,38 |
0,5 |
13 |
2 |
|
Centre gauche |
|
Le Peuple de la liberté |
11 180 |
14,40 |
13,9 |
4 |
10 |
|
Centre droit |
|
Liste Paroli (SC) |
7 463 |
9,62 |
Nv. |
3 |
3 |
|
Centre droit |
|
Ligue |
6 724 |
8,66 |
7,2 |
2 |
6 |
|
Centre droit |
|
Mouvement 5 étoiles |
5 238 |
6,75 |
Nv. |
0 |
|
|
Aucune |
|
Brescia 2013 |
4 555 |
5,87 |
0,4 |
2 |
1 |
|
Aucune |
|
Del Bono pour la mairie |
4 095 |
5,28 |
Nv. |
2 |
2 |
|
Centre gauche |
|
Brescia au travail (SEL) |
3 564 |
4,59 |
Nv. |
2 |
2 |
|
Centre gauche |
|
Liste Onofri |
2 378 |
3,06 |
0,3 |
0 |
|
|
Onofri pour la mairie |
|
Frères d'Italie |
2 132 |
2,75 |
Nv. |
0 |
|
|
Centre droit |
|
Union de centre |
1 942 |
2,50 |
1,4 |
0 |
2 |
|
Centre droit |
|
Plate-forme civique |
1 663 |
2,14 |
Nv. |
0 |
|
|
Onofri pour la mairie |
|
Brescia civique |
863 |
1,11 |
Nv. |
0 |
|
|
Onofri pour la mairie |
|
Parti de la refondation communiste |
581 |
0,75 |
0,8 |
0 |
|
|
Aucune |
|
Avec les gens |
551 |
0,71 |
Nv. |
0 |
|
|
Centre gauche |
|
Forza Nuova |
540 |
0,70 |
0,1 |
0 |
|
|
Aucune |
|
Écologistes et réseaux civiques |
489 |
0,63 |
0,4 |
0 |
|
|
Centre gauche |
|
Esprits libres (PSI) |
464 |
0,60 |
Nv. |
0 |
|
|
Centre gauche |
|
Parti des retraités |
458 |
0,59 |
0,4 |
0 |
|
|
Centre droit |
|
Brescia solidaire et libertaire |
447 |
0,58 |
Nv. |
0 |
|
|
Aucune |
|
Brescia du futur |
286 |
0,37 |
Nv. |
0 |
|
|
Centre droit |
|
Volontaires pour tous |
285 |
0,37 |
Nv. |
0 |
|
|
Centre droit |
|
Femmes pour Brescia |
195 |
0,25 |
Nv. |
0 |
|
|
Aucune |
|
Parti libéral italien |
183 |
0,24 |
Nv. |
0 |
|
|
Centre droit |
|
Parti Italie nouvelle |
84 |
0,11 |
Nv. |
0 |
|
|
Aucune |
|
| Total |
77 614 |
100 |
- |
28 |
|
|
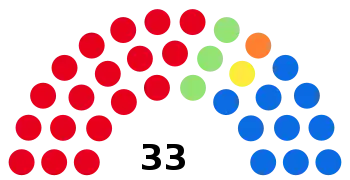
Valeria Mancinelli succède à Fiorello Gramillano, tous deux du Parti démocrate. Le Centre-gauche conserve la mairie d'Ancône.
← Résultats des Élections municipales de 2013 à Ancône [7] →
  |
| Mairie |
Conseil |
Total |
| 1er tour |
2e tour |
| Candidats |
Votes |
% |
Votes |
% |
Élus |
Partis |
Votes |
% |
+/- |
Sièges |
+/- |
|
Valeria Mancinelli |
17 212 |
37,65 |
20 669 |
62,59 |
1 |
|
Parti démocrate |
10 733 |
26,34 |
2,0 |
14 |
4 |
|
|
Ancône 2020 |
1 676 |
4,11 |
Nv. |
2 |
2 |
|
Fédération des Verts |
1 452 |
3,56 |
2,4 |
2 |
2 |
|
Union de centre |
1 400 |
3,44 |
1,4 |
1 |
1 |
|
Choix civique pour l'Italie |
1 300 |
3,19 |
Nv. |
1 |
1 |
| Total Centre gauche |
16 561 |
40,64 |
0,5 |
20 |
4 |
21 |
|
Italo D’Angelo |
9 381 |
20,52 |
12 356 |
37,41 |
1 |
|
Le Peuple de la liberté |
4 236 |
10,39 |
20,7 |
2 |
8 |
|
|
Ancône est à vous |
3 086 |
7,57 |
Nv. |
2 |
2 |
| Total Centre droit |
7 322 |
17,96 |
21,7 |
4 |
6 |
5 |
|
Andre Quattrini |
6 880 |
15,05 |
|
1 |
|
Mouvement 5 étoiles |
5 720 |
14,04 |
9,3 |
3 |
3 |
4 |
|
Stefano Crispoiani |
4 344 |
9,50 |
|
1 |
|
Gauche, écologie et liberté |
2 976 |
7,30 |
1,7 |
1 |
1 |
|
|
Fédération de la gauche |
894 |
2,19 |
1,9 |
— |
2 |
| Total Gauche |
3 870 |
9,50 |
Nv. |
1 |
1 |
2 |
|
Stefano Tombolini |
3 029 |
6,63 |
|
1 |
|
60 100 Ancône |
2 798 |
6,87 |
Nv. |
— |
|
1 |
|
Matteo Bilei |
1 355 |
2,96 |
|
— |
|
A20 - Pour le partage |
1 081 |
2,65 |
Nv. |
— |
|
0 |
|
Stefano Gostoli |
1 261 |
2,76 |
|
— |
|
Frères d'Italie |
1 071 |
2,63 |
Nv. |
— |
|
0 |
|
Letizia Perticaroli |
884 |
1,93 |
|
— |
|
Alliance pour Ancône |
847 |
2,08 |
Nv. |
— |
|
0 |
|
Marcello Pesaresi |
829 |
1,81 |
|
— |
|
Projet pour la ville |
887 |
2,18 |
Nv. |
— |
|
0 |
|
David Favia |
538 |
1,18 |
|
— |
|
Centre démocrate |
594 |
1,46 |
Nv. |
— |
|
0 |
|
|
| Votes valides |
45 713 |
96,98 |
33 025 |
97,13 |
|
Votes valides |
40 751 |
86,45 |
|
| Votes blancs et nuls |
1 425 |
3,02 |
977 |
2,87 |
Votes blancs et nuls |
6 387 |
13,55 |
| Total candidats |
47 138 |
100 |
34 002 |
100 |
5 |
Total partis |
47 138 |
100 |
- |
28 |
7 |
33 |
| Abstentions |
33 861 |
41,80 |
46 997 |
58,02 |
|
Abstentions |
33 861 |
41,80 |
|
| Inscrits/participation |
80 999 |
58,20 |
80 999 |
41,98 |
Inscrits/participation |
80 999 |
58,20 |
|
Vote populaire
Résultats classés par listes
| Partis |
Votes |
% |
+/- |
S. |
+/- |
Coalition |
|---|
|
Parti démocrate |
10 733 |
26,34 |
2,0 |
14 |
4 |
|
Centre gauche |
|
Mouvement 5 étoiles |
5 720 |
14,04 |
9,3 |
3 |
3 |
|
Aucune |
|
Le Peuple de la liberté |
4 236 |
10,39 |
20,7 |
2 |
8 |
|
Centre droit |
|
Ancône est à vous |
3 086 |
7,57 |
Nv. |
2 |
2 |
|
Centre droit |
|
Gauche, écologie et liberté |
2 976 |
7,30 |
1,7 |
1 |
1 |
|
Gauche |
|
60 100 Ancône |
2 798 |
6,87 |
Nv. |
0 |
|
|
Aucune |
|
Ancône 2020 |
1 676 |
4,11 |
Nv. |
2 |
2 |
|
Centre gauche |
|
Fédération des Verts |
1 452 |
3,56 |
2,4 |
2 |
2 |
|
Centre gauche |
|
Union de centre |
1 400 |
3,44 |
1,4 |
1 |
1 |
|
Centre gauche |
|
Choix civique pour l'Italie |
1 300 |
3,19 |
Nv. |
1 |
1 |
|
Centre gauche |
|
A20 - Pour le partage |
1 081 |
2,65 |
Nv. |
0 |
|
|
Aucune |
|
Frères d'Italie |
1 071 |
2,63 |
Nv. |
0 |
|
|
Aucune |
|
Fédération de la gauche |
894 |
2,19 |
1,9 |
0 |
2 |
|
Gauche |
|
Projet pour la ville |
887 |
2,18 |
Nv. |
0 |
|
|
Aucune |
|
Alliance pour Ancône |
847 |
2,08 |
Nv. |
0 |
|
|
Aucune |
|
Centre démocrate |
594 |
1,46 |
Nv. |
0 |
|
|
Aucune |
|
| Total |
40 751 |
100 |
- |
28 |
7 |
|
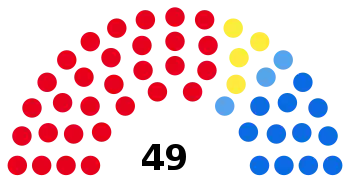
Ignazio Marino, du centre-gauche, défait le maire sortant, Gianni Alemanno, du centre-droit, au second tour.
← Résultats des Élections municipales de 2013 à Rome[8] →
  |
| Mairie |
Conseil |
Total |
| 1er tour |
2e tour |
| Candidats |
Votes |
% |
Votes |
% |
Élus |
Partis |
Votes |
% |
+/- |
Sièges |
+/- |
|
Ignazio Marino |
512 720 |
42,61 |
664 490 |
63,93 |
1 |
|
Parti démocrate |
267 605 |
26,26 |
7,7 |
19 |
2 |
|
|
Marino pour la mairie |
75 494 |
7,41 |
Nv. |
5 |
5 |
|
Gauche, écologie et liberté |
63 728 |
6,25 |
Nv. |
4 |
4 |
|
Centre démocrate |
14 735 |
1,45 |
Nv. |
1 |
1 |
|
Fédération des Verts |
6 299 |
0,62 |
0,6 |
— |
|
|
Parti socialiste italien |
5 853 |
0,57 |
0,2 |
— |
|
| Total Centre-gauche |
433 714 |
42,57 |
5,3 |
29 |
8 |
30 |
|
Giovanni Alemanno |
364 337 |
30,28 |
374 883 |
36,07 |
1 |
|
Le Peuple de la liberté |
195 749 |
19,21 |
17,4 |
7 |
28 |
|
|
Frères d'Italie |
60 375 |
5,93 |
Nv. |
2 |
2 |
|
Citoyens pour Rome |
50 239 |
4,93 |
Nv. |
2 |
2 |
|
La Droite |
13 256 |
1,30 |
2,1 |
— |
1 |
|
Mouvement Union italienne |
2 036 |
0,20 |
Nv. |
— |
|
|
Bleu italien |
1 617 |
0,16 |
Nv. |
— |
|
| Total Centre-droit |
323 272 |
31,73 |
7,9 |
11 |
25 |
12 |
|
Marcello De Vito |
149 665 |
12,44 |
|
1 |
|
Mouvement 5 étoiles |
130 635 |
12,82 |
Nv. |
3 |
3 |
4 |
|
Alfio Marchini |
114 169 |
9,49 |
|
1 |
|
Alfio Marchini maire |
76 203 |
7,48 |
Nv. |
2 |
2 |
|
|
Changeons avec Rome |
3 404 |
0,33 |
Nv. |
— |
|
| Total Marchini pour la mairie |
79 607 |
7,81 |
Nv. |
2 |
2 |
3 |
|
Sandro Medici |
26 825 |
2,23 |
|
— |
|
Fédération de la gauche |
11 629 |
1,14 |
3,4 |
— |
2 |
|
|
République romaine |
7 940 |
0,78 |
Nv. |
— |
|
|
Parti pirate |
715 |
0,07 |
Nv. |
— |
|
| Total Gauche |
20 284 |
1,99 |
Nv. |
— |
|
0 |
|
Alfonso Luigi Marra |
14 307 |
1,19 |
|
— |
|
Liste des grillons parlants-No Euro |
6 552 |
0,64 |
0,3 |
— |
|
|
|
Forza Roma |
1 416 |
0,14 |
0,2 |
— |
|
|
Non à la fermeture des hôpitaux |
1 304 |
0,13 |
Nv. |
— |
|
|
Animalistes environnementalistes |
1 004 |
0,10 |
Nv. |
— |
|
|
Retraités et dignité |
995 |
0,10 |
Nv. |
— |
|
|
Réduisons de moitié le salaire des politiciens |
901 |
0,09 |
Nv. |
— |
|
|
Vive l’Italie |
450 |
0,04 |
Nv. |
— |
|
|
Front justicialiste |
134 |
0,01 |
Nv. |
— |
|
|
Lega Italica |
129 |
0,01 |
Nv. |
— |
|
| Total Marra pour la mairie |
12 885 |
1,26 |
Nv. |
— |
|
0 |
|
Simone De Stefano |
7 166 |
0,60 |
|
— |
|
CasaPound |
6 295 |
0,62 |
Nv. |
— |
|
0 |
|
Gianguido Saletnich |
2 044 |
0,17 |
|
— |
|
Forza Nuova |
1 780 |
0,17 |
0,2 |
— |
|
0 |
|
Alessandro Bianchi |
2 006 |
0,17 |
|
— |
|
Projet Rome |
1 831 |
0,18 |
Nv. |
— |
|
0 |
|
Giovanni Palladino |
1 800 |
0,15 |
|
— |
|
Populaire, libre et forte |
1 593 |
0,16 |
Nv. |
— |
|
0 |
|
Luca Romagnoli |
1 795 |
0,15 |
|
— |
|
Flamme Tricolore |
1 556 |
0,15 |
0,2 |
— |
|
0 |
|
Fabrizio Verduchi |
1 074 |
0,09 |
|
— |
|
Italie chrétienne |
855 |
0,08 |
Nv. |
— |
|
0 |
|
Gerardo Valentini |
996 |
0,08 |
|
— |
|
Mouvement de la construction italienne |
975 |
0,10 |
Nv. |
— |
|
0 |
|
Edoardo De Blasio |
974 |
0,08 |
|
— |
|
Parti libéral italien |
837 |
0,08 |
0,1 |
— |
|
0 |
|
Matteo Corsini |
843 |
0,07 |
|
— |
|
Rome revient |
624 |
0,06 |
Nv. |
— |
|
0 |
|
Angelo Novellino |
809 |
0,07 |
|
— |
|
Italie réelle |
618 |
0,06 |
Nv. |
— |
|
0 |
|
Armando Mantuano |
775 |
0,06 |
|
— |
|
Milice chrétienne |
632 |
0,06 |
Nv. |
— |
|
0 |
|
Stefano Tersigni |
624 |
0,05 |
|
— |
|
Rome est à vous |
571 |
0,06 |
Nv. |
— |
|
0 |
|
Valerio De Masi |
406 |
0,03 |
|
— |
|
Parti Italie nouvelle |
347 |
0,03 |
Nv. |
— |
|
0 |
|
|
| Votes valides |
1 203 335 |
96,58 |
1 039 373 |
97,79 |
|
Votes valides |
1 018 911 |
81,78 |
|
| Votes blancs et nuls |
42 592 |
3,42 |
23 519 |
2,21 |
Votes blancs et nuls |
227 016 |
18,22 |
| Total candidats |
1 245 927 |
100 |
1 062 892 |
100 |
4 |
Total partis |
1 245 927 |
100 |
- |
45 |
|
49 |
| Abstentions |
1 113 192 |
47,19 |
1 296 227 |
54,95 |
|
Abstentions |
1 113 192 |
47,19 |
|
| Inscrits/participation |
2 359 119 |
52,81 |
2 359 119 |
45,05 |
Inscrits/participation |
2 359 119 |
52,81 |
|
Vote populaire
Résultats classés par listes
| Partis |
Votes |
% |
+/- |
S. |
+/- |
Coalition |
|---|
|
Parti démocrate |
267 605 |
26,26 |
7,7 |
19 |
2 |
|
Centre gauche |
|
Le Peuple de la liberté |
195 749 |
19,21 |
17,4 |
7 |
28 |
|
Centre droit |
|
Mouvement 5 étoiles |
130 635 |
12,82 |
Nv. |
3 |
3 |
|
Aucune |
|
Alfio Marchini maire |
76 203 |
7,48 |
Nv. |
2 |
2 |
|
Marchini pour la mairie |
|
Marino pour la mairie |
75 494 |
7,41 |
Nv. |
5 |
5 |
|
Centre gauche |
|
Gauche, écologie et liberté |
63 728 |
6,25 |
Nv. |
4 |
4 |
|
Centre gauche |
|
Frères d'Italie |
60 375 |
5,93 |
Nv. |
2 |
2 |
|
Centre droit |
|
Citoyens pour Rome |
50 239 |
4,93 |
Nv. |
2 |
2 |
|
Centre droit |
|
Centre démocrate |
14 735 |
1,45 |
Nv. |
1 |
1 |
|
Centre gauche |
|
La Droite |
13 256 |
1,30 |
2,1 |
0 |
1 |
|
Centre droit |
|
Fédération de la gauche |
11 629 |
1,14 |
3,4 |
0 |
2 |
|
Gauche |
|
République romaine |
7 940 |
0,78 |
Nv. |
0 |
|
|
Gauche |
|
Liste des grillons parlants-No Euro |
6 552 |
0,64 |
0,3 |
0 |
|
|
Marra pour la mairie |
|
Fédération des Verts |
6 299 |
0,62 |
0,6 |
0 |
|
|
Centre gauche |
|
CasaPound |
6 295 |
0,62 |
Nv. |
0 |
|
|
Aucune |
|
Parti socialiste italien |
5 853 |
0,57 |
0,2 |
0 |
|
|
Centre gauche |
|
Changeons avec Rome |
3 404 |
0,33 |
Nv. |
0 |
|
|
Marchini pour la mairie |
|
Mouvement Union italienne |
2 036 |
0,20 |
Nv. |
0 |
|
|
Centre droit |
|
Projet Rome |
1 831 |
0,18 |
Nv. |
0 |
|
|
Aucune |
|
Forza Nuova |
1 780 |
0,17 |
0,2 |
0 |
|
|
Aucune |
|
Bleu italien |
1 617 |
0,16 |
Nv. |
0 |
|
|
Centre droit |
|
Populaire, libre et forte |
1 593 |
0,16 |
Nv. |
0 |
|
|
Aucune |
|
Flamme Tricolore |
1 556 |
0,15 |
0,2 |
0 |
|
|
Aucune |
|
Forza Roma |
1 416 |
0,14 |
0,2 |
0 |
|
|
Marra pour la mairie |
|
Non à la fermeture des hôpitaux |
1 304 |
0,13 |
Nv. |
0 |
|
|
Marra pour la mairie |
|
Animalistes environnementalistes |
1 004 |
0,10 |
Nv. |
0 |
|
|
Marra pour la mairie |
|
Retraités et dignité |
995 |
0,10 |
Nv. |
0 |
|
|
Marra pour la mairie |
|
Mouvement de la construction italienne |
975 |
0,10 |
Nv. |
0 |
|
|
Aucune |
|
Réduisons de moitié le salaire des politiciens |
901 |
0,09 |
Nv. |
0 |
|
|
Marra pour la mairie |
|
Italie chrétienne |
855 |
0,08 |
Nv. |
0 |
|
|
Aucune |
|
Parti libéral italien |
837 |
0,08 |
0,1 |
0 |
|
|
Aucune |
|
Parti pirate |
715 |
0,07 |
Nv. |
0 |
|
|
Gauche |
|
Rome revient |
624 |
0,06 |
Nv. |
0 |
|
|
Aucune |
|
Italie réelle |
618 |
0,06 |
Nv. |
0 |
|
|
Aucune |
|
Milice chrétienne |
632 |
0,06 |
Nv. |
0 |
|
|
Aucune |
|
Rome est à vous |
571 |
0,06 |
Nv. |
0 |
|
|
Aucune |
|
Vive l’Italie |
450 |
0,04 |
Nv. |
0 |
|
|
Marra pour la mairie |
|
Parti Italie nouvelle |
347 |
0,03 |
Nv. |
0 |
|
|
Aucune |
|
Front justicialiste |
134 |
0,01 |
Nv. |
0 |
|
|
Marra pour la mairie |
|
Lega Italica |
129 |
0,01 |
Nv. |
0 |
|
|
Marra pour la mairie |
|
| Total |
1 018 911 |
100 |
- |
45 |
|
|
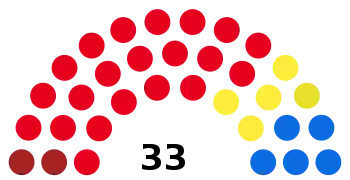
L'ancien maire Enzo Bianco (PD) défait le maire sortant Raffaele Stancanelli (PdL) dès le premier tour. Le Centre-gauche reprend la mairie de Catane.
← Résultats des Élections municipales de 2013 à Catane[9] - [10] →
  |
| Mairie |
Conseil |
Total |
| Candidats |
Votes |
% |
Élus |
Partis |
Votes |
% |
+/- |
Sièges |
+/- |
|
Enzo Bianco |
44 537 |
50,62 |
1 |
|
Pacte pour Catane |
21 050 |
14,54 |
6,9 |
8 |
4 |
|
|
Le Mégaphone - Liste Crocetta |
15 428 |
10,66 |
Nv. |
5 |
5 |
|
Article 4 |
14 779 |
10,21 |
Nv. |
5 |
5 |
|
Parti démocrate |
14 435 |
9,97 |
1,4 |
5 |
1 |
|
Printemps pour Catane |
11 073 |
7,65 |
Nv. |
4 |
4 |
|
Gauche pour Catane (SEL) |
1 194 |
0,82 |
Nv. |
— |
|
|
Démocratie fédérale |
454 |
0,31 |
Nv. |
— |
|
| Total Centre gauche |
78 413 |
54,26 |
36,6 |
27 |
19 |
28 |
|
Raffaele Stancanelli |
32 218 |
36,62 |
— |
|
Le Peuple de la liberté |
20 060 |
13,86 |
9,1 |
7 |
5 |
|
|
Grande Catane |
15 881 |
10,97 |
Nv. |
6 |
6 |
|
Tous pour Catane |
14 662 |
10,13 |
Nv. |
5 |
5 |
|
Chantier populaire |
1 941 |
1,34 |
Nv. |
— |
|
| Total Centre droit |
52 544 |
36,30 |
31,6 |
18 |
14 |
18 |
|
Maurizio Caserta |
6 476 |
7,36 |
— |
|
Liste Maurizio Caserta |
5 855 |
4,05 |
Nv. |
— |
|
0 |
|
Lidia Adorno |
2 989 |
3,40 |
— |
|
Mouvement 5 étoiles |
5 869 |
4,05 |
3,5 |
— |
|
0 |
|
Matteo Iannitti |
1 393 |
1,58 |
— |
|
Catane bien commun |
1 418 |
0,98 |
Nv. |
— |
|
0 |
|
Salvatore d’Urso |
378 |
0,43 |
— |
|
Réparer Catane |
663 |
0,46 |
Nv. |
— |
|
0 |
|
|
| Votes valides |
87 991 |
51,89 |
|
Votes valides |
144 762 |
85,37 |
|
| Votes blancs et nuls |
81 584 |
48,11 |
Votes blancs et nuls |
24 813 |
14,63 |
| Total candidats |
169 575 |
100 |
1 |
Total partis |
169 575 |
100 |
- |
45 |
|
46 |
| Abstentions |
98 126 |
36,66 |
|
|
| Inscrits/participation |
267 701 |
63,34 |
Vote populaire
Résultats classés par listes
| Partis |
Votes |
% |
+/- |
S. |
+/- |
Coalition |
|---|
|
Pacte pour Catane |
21 050 |
14,54 |
6,9 |
8 |
4 |
|
Centre gauche |
|
Le Peuple de la liberté |
20 060 |
13,86 |
9,1 |
7 |
5 |
|
Centre droit |
|
Grande Catane |
15 881 |
10,97 |
Nv. |
6 |
6 |
|
Centre droit |
|
Le Mégaphone - Liste Crocetta |
15 428 |
10,66 |
Nv. |
5 |
5 |
|
Centre gauche |
|
Article 4 |
14 779 |
10,21 |
Nv. |
5 |
5 |
|
Centre gauche |
|
Tous pour Catane |
14 662 |
10,13 |
Nv. |
5 |
5 |
|
Centre droit |
|
Parti démocrate |
14 435 |
9,97 |
1,4 |
5 |
1 |
|
Centre gauche |
|
Printemps pour Catane |
11 073 |
7,65 |
Nv. |
4 |
4 |
|
Centre gauche |
|
Mouvement 5 étoiles |
5 869 |
4,05 |
3,5 |
0 |
|
|
Aucune |
|
Liste Maurizio Caserta |
5 855 |
4,05 |
Nv. |
0 |
|
|
Aucune |
|
Chantier populaire |
1 941 |
1,34 |
Nv. |
0 |
|
|
Centre droit |
|
Catane bien commun |
1 418 |
0,98 |
Nv. |
0 |
|
|
Aucune |
|
Gauche pour Catane (SEL) |
1 194 |
0,82 |
Nv. |
0 |
|
|
Centre gauche |
|
Réparer Catane |
663 |
0,46 |
Nv. |
0 |
|
|
Aucune |
|
Démocratie fédérale |
454 |
0,31 |
Nv. |
0 |
|
|
Centre gauche |
|
| Total |
144 762 |
100 |
- |
45 |
|
|
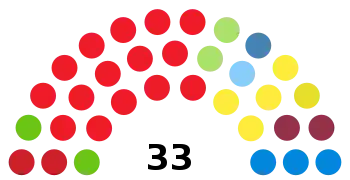
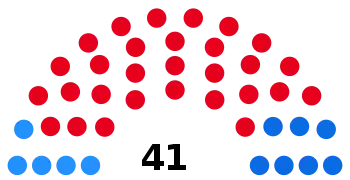
Tentant de succéder à Giuseppe Buzzanca (PdL), le candidat du Centre-droit, Vincenzo Garofalo, est défait dès le premier tour, tandis que le démocrate Felice Calabro manque de peu la victoire dès le premier tour, et affronte au ballotage le militant de gauche et candidat indépendant, Renato Accorinti. Cependant, c'est Accorinti qui l'emporte au second tour, devenant le premier maire de gauche (et indépendant) de la ville de Messine. Malgré cela, le Centre-gauche obtient la majorité au conseil municipal.
← Résultats des Élections municipales de 2013 à Messine[11] - [12] - [13] →
  |
| Mairie |
Conseil |
Total |
| 1er tour |
2e tour |
| Candidats |
Votes |
% |
Votes |
% |
Élus |
Partis |
Votes |
% |
+/- |
Sièges |
+/- |
|
Renato Accorinti |
19 540 |
23,88 |
47 866 |
52,67 |
1 |
|
Liste Accorinti |
10 338 |
8,20 |
Nv. |
4 |
4 |
5 |
|
Felice Calabro |
40 870 |
49,94 |
43 017 |
47,33 |
— |
|
Union de centre |
15 897 |
12,60 |
7,2 |
6 |
3 |
|
|
Parti démocrate |
15 365 |
12,18 |
0,4 |
6 |
|
|
Démocrates réformistes |
14 586 |
11,56 |
Nv. |
6 |
6 |
|
Le Mégaphone - Liste Crocetta |
11 309 |
8,97 |
Nv. |
4 |
4 |
|
Progressistes démocrates |
10 047 |
7,97 |
Nv. |
4 |
4 |
|
Liste Calabro |
9 580 |
7,60 |
Nv. |
3 |
3 |
|
Le Papillon |
3 605 |
2,86 |
Nv. |
— |
|
|
Messine nouvelle |
2 130 |
1,69 |
Nv. |
— |
|
| Total Centre gauche |
82 519 |
65,43 |
25,9 |
29 |
13 |
29 |
|
Vincenzo Garofalo |
15 130 |
18,49 |
|
— |
|
Le Peuple de la liberté |
13 185 |
10,45 |
7,0 |
5 |
5 |
|
|
Nous sommes Messine |
7 081 |
5,61 |
Nv. |
2 |
2 |
|
Frères d'Italie |
2 089 |
1,66 |
Nv. |
— |
|
|
Gens d’avenir |
1 418 |
1,12 |
Nv. |
— |
|
|
Autonomistes pour Messine |
1 099 |
0,87 |
Nv. |
— |
|
| Total Centre droit |
24 872 |
19,71 |
33,8 |
7 |
20 |
7 |
|
Gianfranco Scoglio |
2 351 |
2,87 |
|
— |
|
Nouvelle alliance |
3 564 |
2,83 |
Nv. |
— |
|
0 |
|
Maria Saija |
2 348 |
2,87 |
|
— |
|
Mouvement 5 étoiles |
3 192 |
2,53 |
Nv. |
— |
|
0 |
|
Alessandro Tinaglia |
1 592 |
1,95 |
|
— |
|
Reset! |
1 641 |
1,30 |
Nv. |
— |
|
0 |
|
|
| Votes valides |
81 831 |
57,77 |
90 883 |
98,34 |
|
Votes valides |
126 126 |
89,03 |
|
| Votes blancs et nuls |
59 831 |
42,23 |
1 530 |
1,66 |
Votes blancs et nuls |
15 536 |
10,97 |
| Total candidats |
141 662 |
100 |
92 413 |
100 |
1 |
Total partis |
141 662 |
100 |
- |
40 |
5 |
41 |
| Abstentions |
60 077 |
29,78 |
109 326 |
54,19 |
|
Abstentions |
60 077 |
29,78 |
|
| Inscrits/participation |
201 739 |
70,22 |
201 739 |
45,81 |
Inscrits/participation |
201 739 |
70,22 |
|
Vote populaire
Résultats classés par listes
| Partis |
Votes |
% |
+/- |
S. |
+/- |
Coalition |
|---|
|
Union de centre |
15 897 |
12,60 |
7,2 |
6 |
3 |
|
Centre gauche |
|
Parti démocrate |
15 365 |
12,18 |
0,4 |
6 |
|
|
Centre gauche |
|
Démocrates réformistes |
14 586 |
11,56 |
Nv. |
6 |
6 |
|
Centre gauche |
|
Le Peuple de la liberté |
13 185 |
10,45 |
7,0 |
5 |
5 |
|
Centre droit |
|
Le Mégaphone - Liste Crocetta |
11 309 |
8,97 |
Nv. |
4 |
4 |
|
Centre gauche |
|
Liste Accorinti |
10 338 |
8,20 |
Nv. |
4 |
4 |
|
Aucune |
|
Progressistes démocrates |
10 047 |
7,97 |
Nv. |
4 |
4 |
|
Centre gauche |
|
Liste Calabro |
9 580 |
7,60 |
Nv. |
3 |
3 |
|
Centre gauche |
|
Nous sommes Messine |
7 081 |
5,61 |
Nv. |
2 |
2 |
|
Centre droit |
|
Le Papillon |
3 605 |
2,86 |
Nv. |
0 |
|
|
Centre gauche |
|
Nouvelle alliance |
3 564 |
2,83 |
Nv. |
0 |
|
|
Aucune |
|
Mouvement 5 étoiles |
3 192 |
2,53 |
Nv. |
0 |
|
|
Aucune |
|
Messine nouvelle |
2 130 |
1,69 |
Nv. |
0 |
|
|
Centre gauche |
|
Frères d'Italie |
2 089 |
1,66 |
Nv. |
0 |
|
|
Centre droit |
|
Reset! |
1 641 |
1,30 |
Nv. |
0 |
|
|
Aucune |
|
Gens d’avenir |
1 418 |
1,12 |
Nv. |
0 |
|
|
Centre droit |
|
Autonomistes pour Messine |
1 099 |
0,87 |
Nv. |
0 |
|
|
Centre droit |
|
| Total |
126 126 |
100 |
- |
40 |
|
|