Élections législatives de 2002 dans le Pas-de-Calais
Les élections législatives françaises de 2002 se déroulent les 9 et . Dans le département du Pas-de-Calais, quatorze députés sont à élire dans le cadre de quatorze circonscriptions.
| Élections législatives de 2002 dans le Pas-de-Calais | |||||
| 14 sièges de députés à l'Assemblée nationale | |||||
|---|---|---|---|---|---|
| et | |||||
| Corps électoral et résultats | |||||
| Inscrits | 1 050 443 | ||||
| Votants au 1er tour | 663 359 | ||||
| 63,15 % | |||||
| Votes exprimés au 1er tour | 644 272 | ||||
| Votants au 2d tour | 635 469 | ||||
| 60,5 % | |||||
| Votes exprimés au 2d tour | 597 511 | ||||
| Gauche parlementaire | |||||
| Voix au 1er tour | 293 543 | ||||
| 45,56 % | |||||
| Voix au 2e tour | 342 314 | ||||
| 57,29 % | |||||
| Députés élus | 12 | ||||
| Majorité présidentielle | |||||
| Voix au 1er tour | 192 567 | ||||
| 29,89 % | |||||
| Voix au 2e tour | 206 565 | ||||
| 34,57 % | |||||
| Députés élus | 2 | ||||
| Front national | |||||
| Voix au 1er tour | 87 048 | ||||
| 13,51 % | |||||
| Voix au 2e tour | 48 632 | ||||
| 8,14 % | |||||
| Députés élus | 0 | ||||
| Députés sortants par circonscription | |||||
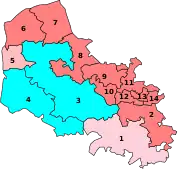
| |||||
| Députés élus par circonscription | |||||
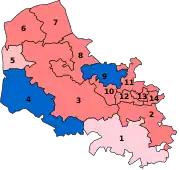
| |||||
Élus
| Circonsription | Député sortant | Parti | Député élu ou réélu | Parti | ||
|---|---|---|---|---|---|---|
| 1re | Jean-Pierre Defontaine | PRG | Jean-Pierre Defontaine | PRG | ||
| 2e | Catherine Génisson | PS | Catherine Génisson | PS | ||
| 3e | Jean-Claude Leroy | PS | Jean-Claude Leroy | PS | ||
| 4e | Léonce Deprez | UDF (FD) | Léonce Deprez | UMP | ||
| 5e | Guy Lengagne | Divers gauche | Guy Lengagne | Divers gauche | ||
| 6e | Dominique Dupilet | PS | Jack Lang | PS | ||
| 7e | Gilles Cocquempot | PS | Gilles Cocquempot | PS | ||
| 8e | Michel Lefait | PS | Michel Lefait | PS | ||
| 9e | Bernard Seux | Pôle républicain | André Flajolet | UMP | ||
| 10e | Serge Janquin | PS | Serge Janquin | PS | ||
| 11e | Marcel Cabiddu | PS | Marcel Cabiddu | PS | ||
| 12e | Jean-Pierre Kucheida | PS | Jean-Pierre Kucheida | PS | ||
| 13e | Jean-Claude Bois | PS | Jean-Claude Bois | PS | ||
| 14e | Albert Facon | PS | Albert Facon | PS | ||
Résultats
Résultats à l'échelle du département
| Parti | Premier tour | Second tour | Sièges | |||
|---|---|---|---|---|---|---|
| Voix | % | Voix | % | |||
| Parti socialiste dont PRG | 205 122 | 31,84 | 324 591 | 54,32 | 11 | |
| Parti communiste français | 43 217 | 6,71 | 0 | |||
| Pôle républicain dont Divers gauche | 33 140 | 5,14 | 17 723 | 2,97 | 1 | |
| Les Verts | 12 064 | 1,87 | 0 | |||
| Gauche parlementaire | 293 543 | 45,56 | 342 314 | 57,29 | 12 | |
| Union pour un mouvement populaire | 145 878 | 22,64 | 206 565 | 34,57 | 2 | |
| Union pour la démocratie française | 23 108 | 3,59 | 0 | |||
| Divers droite | 17 028 | 2,64 | 0 | |||
| Mouvement pour la France | 6 553 | 1,02 | 0 | |||
| Majorité présidentielle | 192 567 | 29,89 | 206 565 | 34,57 | 2 | |
| Front national | 87 048 | 13,51 | 48 632 | 8,14 | 0 | |
| Extrême gauche dont LCR, LO et PT | 28 403 | 4,41 | 0 | |||
| Chasse, pêche, nature et traditions | 23 459 | 3,64 | 0 | |||
| Divers écologiste dont LT-LNÉ, MÉI, et GÉ | 9 910 | 1,54 | 0 | |||
| Extrême droite dont MNR | 6 042 | 0,94 | 0 | |||
| Divers | 3 300 | 0,51 | 0 | |||
| Inscrits | 1 050 443 | 100,00 | 1 050 444 | 100,00 | 14 | |
| Abstentions | 387 084 | 36,85 | 414 975 | 39,5 | ||
| Votants | 663 359 | 63,15 | 635 469 | 60,5 | ||
| Blancs et nuls | 19 087 | 2,88 | 37 958 | 5,97 | ||
| Exprimés | 644 272 | 97,12 | 597 511 | 94,03 | ||
| Source : Ministère de l'Intérieur - Pas-de-Calais | ||||||
Première circonscription (Arras-Bapaume)
| Candidat | Parti | Premier tour | Second tour | ||||
|---|---|---|---|---|---|---|---|
| Voix | % | Voix | % | ||||
| Jean-Pierre Defontaine sortant réélu | PRG (PS) | 16 071 | 31,39 | 24 501 | 50,54 | ||
| Philippe Rapeneau | UMP | 11 861 | 23,17 | 23 974 | 49,46 | ||
| Denise Bocquillet | UDF | 6 146 | 12,01 | ||||
| Jean-Marc Maurice | FN | 6 064 | 11,85 | ||||
| Isabelle Carré | CPNT | 2 495 | 4,87 | ||||
| Gérard Pavy | Divers droite | 1 895 | 3,70 | ||||
| Christiane Ducamp | Les Verts | 1 388 | 2,71 | ||||
| Michella Jaffré | PCF | 1 123 | 2,19 | ||||
| Isabelle Brunet | LO | 908 | 1,77 | ||||
| Fabien Besson | LCR | 859 | 1,68 | ||||
| Bertrand Alexandre | Pôle républicain | 736 | 1,44 | ||||
| Philippe Fourmaux | MPF | 431 | 0,84 | ||||
| Danielle d'Hollander | MNR | 423 | 0,83 | ||||
| Arnold Massart | Sans étiquette | 306 | 0,60 | ||||
| Fatima Blaha | GÉ | 167 | 0,33 | ||||
| Jean-Jacques Dambreville | Divers écologiste | 164 | 0,32 | ||||
| Danielle Briche | Sans étiquette | 154 | 0,30 | ||||
| Bertrand Poullain | Divers droite | 0 | 0,00 | ||||
| Inscrits | 77 802 | 100,00 | 77 798 | 100,00 | |||
| Abstentions | 25 022 | 32,16 | 26 421 | 33,96 | |||
| Votants | 52 780 | 67,84 | 51 377 | 66,04 | |||
| Blancs et nuls | 1 589 | 3,01 | 2 902 | 5,65 | |||
| Exprimés | 51 191 | 96,99 | 48 475 | 94,35 | |||
Deuxième circonscription (Arras-Nord)
| Candidat | Parti | Premier tour | Second tour | ||||
|---|---|---|---|---|---|---|---|
| Voix | % | Voix | % | ||||
| Catherine Génisson sortante réélue | PS | 15 812 | 32,71 | 24 766 | 54,16 | ||
| François Desmazière | UMP | 11 995 | 24,82 | 20 962 | 45,84 | ||
| Catherine Salagnac | FN | 6 029 | 12,47 | ||||
| Jean-Marie Alexandre | Pôle républicain | 3 644 | 7,54 | ||||
| Jean-François Depret | MPF | 3 298 | 6,82 | ||||
| Jean-Michel Becquet | CPNT | 2 230 | 4,61 | ||||
| Jacques Patris | PCF | 1 340 | 2,77 | ||||
| Monique Suckerdoff | Les Verts | 772 | 1,6 | ||||
| Catherine Adamus | LO | 741 | 1,53 | ||||
| Armelle Pertus | LCR | 712 | 1,47 | ||||
| Dominique Lermoyer | LT-LNÉ | 648 | 1,34 | ||||
| Dominique Denghin | MNR | 395 | 0,82 | ||||
| Éric Venel | MÉI | 312 | 0,65 | ||||
| Éric Julien | Divers | 229 | 0,47 | ||||
| Sherif Blaha | GÉ | 103 | 0,21 | ||||
| Guy Roaux | Divers droite | 76 | 0,16 | ||||
| Inscrits | 73 865 | 100,00 | 73 897 | 100,00 | |||
| Abstentions | 24 280 | 32,87 | 25 889 | 35,03 | |||
| Votants | 49 585 | 67,13 | 48 008 | 64,97 | |||
| Blancs et nuls | 1 249 | 2,52 | 2 280 | 4,75 | |||
| Exprimés | 48 336 | 97,48 | 45 728 | 95,25 | |||
Troisième circonscription (Fruges)
| Candidat | Parti | Premier tour | Second tour | ||||
|---|---|---|---|---|---|---|---|
| Voix | % | Voix | % | ||||
| Jean-Claude Leroy sortant réélu | PS | 20 147 | 39,09 | 27 590 | 53,66 | ||
| Brigitte de Prémont | UMP | 17 220 | 33,41 | 23 822 | 46,34 | ||
| Catherine Mancheron | FN | 4 898 | 9,5 | ||||
| Jean-Louis Desvignes | CPNT | 3 044 | 5,91 | ||||
| Alain Libert | PCF | 1 499 | 2,91 | ||||
| Hubert Houliez | MPF | 881 | 1,71 | ||||
| Raymond Merlin | LO | 768 | 1,49 | ||||
| Ingrid Hayes | LCR | 681 | 1,32 | ||||
| Jean-François Marquis | Les Verts | 631 | 1,22 | ||||
| Denise Fruchart | Divers écologiste | 583 | 1,13 | ||||
| Jean-Pierre d'Hollander | MNR | 512 | 0,99 | ||||
| Nicole Canlers | Pôle républicain | 373 | 0,72 | ||||
| Frédéric Vidal | MÉI | 221 | 0,43 | ||||
| Khelifa Hamida | GÉ | 86 | 0,17 | ||||
| Inscrits | 73 013 | 100,00 | 73 007 | 100,00 | |||
| Abstentions | 19 949 | 27,32 | 19 303 | 26,44 | |||
| Votants | 53 064 | 72,68 | 53 704 | 73,56 | |||
| Blancs et nuls | 1 520 | 2,86 | 2 292 | 4,27 | |||
| Exprimés | 51 544 | 97,14 | 51 412 | 95,73 | |||
Quatrième circonscription (Montreuil)
| Candidat | Parti | Premier tour | Second tour | ||||
|---|---|---|---|---|---|---|---|
| Voix | % | Voix | % | ||||
| Léonce Deprez sortant réélu | UMP | 17 908 | 37,35 | 26 988 | 59,15 | ||
| Danièle Lhomme | PS | 12 039 | 25,11 | 18 638 | 40,85 | ||
| Didier Frémaux | CPNT | 4 544 | 9,48 | ||||
| Isabelle Leroy | FN | 4 515 | 9,42 | ||||
| Jean-Pierre Level | Divers droite (Maj. prés.) | 3 566 | 7,44 | ||||
| Josette Samson | PCF | 1 064 | 2,22 | ||||
| Patrick Macquet | LO | 731 | 1,52 | ||||
| Julien Beuzard | Extrême droite | 731 | 1,52 | ||||
| Antoine Duport | Divers droite | 672 | 1,4 | ||||
| Martine Mocomble | Les Verts | 618 | 1,29 | ||||
| Séverine Mucin | Divers écologiste | 439 | 0,92 | ||||
| Françoise Dufour | Pôle républicain | 418 | 0,87 | ||||
| Bernard Lebas | MÉI | 245 | 0,51 | ||||
| Mayté Varaut | MPF | 167 | 0,35 | ||||
| Sophie Vermeulen | Extrême gauche | 139 | 0,29 | ||||
| Corinne Guasmia | GÉ | 77 | 0,16 | ||||
| Pierre Secret | Divers | 74 | 0,15 | ||||
| Inscrits | 76 741 | 100,00 | 76 745 | 100,00 | |||
| Abstentions | 27 517 | 35,86 | 28 656 | 37,34 | |||
| Votants | 49 224 | 64,14 | 48 089 | 62,66 | |||
| Blancs et nuls | 1 277 | 2,59 | 2 463 | 5,12 | |||
| Exprimés | 47 947 | 97,41 | 45 626 | 94,88 | |||
Cinquième circonscription (Boulogne-sur-Mer)
| Candidat | Parti | Premier tour | Second tour | ||||
|---|---|---|---|---|---|---|---|
| Voix | % | Voix | % | ||||
| Guy Lengagne sortant réélu | Divers gauche | 11 062 | 29,64 | 17 723 | 50,81 | ||
| Jean-Pierre Pont | UMP | 7 996 | 21,42 | 17 155 | 49,19 | ||
| Laurent Feutry | UDF | 6 750 | 18,08 | ||||
| Jean-Claude Juda | PCF | 3 495 | 9,36 | ||||
| Monique Sgard | FN | 3 476 | 9,31 | ||||
| Danièle Nuttens | CPNT | 803 | 2,15 | ||||
| Frédéric Garet | Les Verts | 727 | 1,95 | ||||
| Pierre Madelain | LO | 635 | 1,7 | ||||
| Stéphane Savard | LCR | 495 | 1,33 | ||||
| Éric Legros | Pôle républicain | 469 | 1,26 | ||||
| Marie-Lyse Demarque | Divers écologiste | 423 | 1,13 | ||||
| Guy Molliens | MNR | 360 | 0,96 | ||||
| Miguel Torres | MÉI | 244 | 0,65 | ||||
| Martine Lefébure-Thévenet | MPF | 222 | 0,59 | ||||
| Christian Louchez | Extrême gauche | 101 | 0,27 | ||||
| Manuelle Guastalli | GÉ | 66 | 0,18 | ||||
| Inscrits | 63 022 | 100,00 | 63 020 | 100,00 | |||
| Abstentions | 24 757 | 39,28 | 26 068 | 41,36 | |||
| Votants | 38 265 | 60,72 | 36 952 | 58,64 | |||
| Blancs et nuls | 941 | 2,46 | 2 074 | 5,61 | |||
| Exprimés | 37 324 | 97,54 | 34 878 | 94,39 | |||
Sixième circonscription (Guînes)
| Candidat | Parti | Premier tour | Second tour | ||||
|---|---|---|---|---|---|---|---|
| Voix | % | Voix | % | ||||
| Jack Lang élu | PS | 16 305 | 39,03 | 22 204 | 53,83 | ||
| Bernard Deram | UMP | 12 758 | 30,54 | 19 045 | 46,17 | ||
| Michel Somville | FN | 4 294 | 10,28 | ||||
| Gisèle Cocquerelle | PCF | 1 895 | 4,54 | ||||
| Rémi Harle | CPNT | 1 689 | 4,04 | ||||
| Gérard d'Andrea | ÉD | 809 | 1,94 | ||||
| Françoise Millot | LO | 627 | 1,5 | ||||
| Marie-France Level | Les Verts | 627 | 1,5 | ||||
| Jacques Fourny | MNR | 626 | 1,5 | ||||
| Madeleine Cheuva | Pôle républicain | 478 | 1,14 | ||||
| Monique Gumez | Divers écologiste | 364 | 0,87 | ||||
| Angela Stefanatos | LCR | 296 | 0,71 | ||||
| Jeanine Chaufour Royer | MPF | 251 | 0,6 | ||||
| Olivier Dumont | MÉI | 201 | 0,48 | ||||
| Daniel Leau | Divers gauche | 111 | 0,27 | ||||
| Michel Monger | Divers droite | 110 | 0,26 | ||||
| Arlette Deverdenne | Extrême gauche | 109 | 0,26 | ||||
| Nicolas Thirez | RPF | 88 | 0,21 | ||||
| Clotilde Séguy | GÉ | 72 | 0,17 | ||||
| Laurent Condette | Divers gauche | 63 | 0,15 | ||||
| Inscrits | 70 581 | 100,00 | 70 576 | 100,00 | |||
| Abstentions | 27 634 | 39,15 | 27 593 | 39,1 | |||
| Votants | 42 947 | 60,85 | 42 983 | 60,9 | |||
| Blancs et nuls | 1 174 | 2,73 | 1 734 | 4,03 | |||
| Exprimés | 41 773 | 97,27 | 41 249 | 95,97 | |||
Septième circonscription (Calais)
| Candidat | Parti | Premier tour | Second tour | ||||
|---|---|---|---|---|---|---|---|
| Voix | % | Voix | % | ||||
| Gilles Cocquempot sortant réélu | PS | 11 944 | 26,09 | 22 541 | 52,14 | ||
| Natacha Bouchart | UMP | 9 208 | 20,11 | 20 694 | 47,86 | ||
| Michel Ximenes | FN | 6 151 | 13,44 | ||||
| Arnaud Leclair | UDF | 5 313 | 11,61 | ||||
| Marcel Levaillant | PCF | 3 800 | 8,3 | ||||
| Francis Fontaine | CPNT | 2 420 | 5,29 | ||||
| Isabelle Dehouck | Divers droite | 2 130 | 4,65 | ||||
| Dominique Wailly | LO | 1 108 | 2,42 | ||||
| Catherine Bourgeois | Les Verts | 834 | 1,82 | ||||
| Marijana Petrovic-Rignault | LCR | 694 | 1,52 | ||||
| Michel Lenglin | Pôle républicain | 621 | 1,36 | ||||
| Murielle Richet | LT-LNÉ | 599 | 1,31 | ||||
| Catherine Lornier | MNR | 446 | 0,97 | ||||
| Jean-Marc Ben | Extrême gauche | 378 | 0,83 | ||||
| Geneviève Berthet | GÉ | 134 | 0,29 | ||||
| Inscrits | 81 260 | 100,00 | 81 261 | 100,00 | |||
| Abstentions | 34 088 | 41,95 | 35 493 | 43,68 | |||
| Votants | 47 172 | 58,05 | 45 768 | 56,32 | |||
| Blancs et nuls | 1 392 | 2,95 | 2 533 | 5,53 | |||
| Exprimés | 45 780 | 97,05 | 43 235 | 94,47 | |||
Huitième circonscription (Saint-Omer)
| Candidat | Parti | Premier tour | Second tour | ||||
|---|---|---|---|---|---|---|---|
| Voix | % | Voix | % | ||||
| Michel Lefait sortant réélu | PS | 19 402 | 44,13 | 24 634 | 58,26 | ||
| Pascal Bataille | UMP | 12 797 | 29,11 | 17 651 | 41,74 | ||
| Séverine Leturque | FN | 4 515 | 10,27 | ||||
| Bruno Cottrez | CPNT | 1 872 | 4,26 | ||||
| Luc Dubois | LO | 982 | 2,23 | ||||
| François Dubout | RPF | 887 | 2,02 | ||||
| Michel Vanacker | Divers | 752 | 1,71 | ||||
| Elsa Peskine | LCR | 593 | 1,35 | ||||
| Dominique Debelle | Les Verts | 453 | 1,03 | ||||
| Antoinette Hurtrez | Divers écologiste | 445 | 1,01 | ||||
| Monique Gheerardyn | PCF | 399 | 0,91 | ||||
| Odile Fourny | MNR | 388 | 0,88 | ||||
| Pierre Vandenbroucke | Divers écologiste (MÉI) | 208 | 0,47 | ||||
| Isabelle Rosique | Divers écologiste (GÉ) | 100 | 0,23 | ||||
| Véronique Devender | Extrême gauche | 100 | 0,23 | ||||
| Émile Lecoq | Divers | 73 | 0,17 | ||||
| Nicolas Le Jean | Divers | 1 | 0,00 | ||||
| Bernadette Leroy | Extrême droite | 1 | 0,00 | ||||
| Inscrits | 67 261 | 100,00 | 67 256 | 100,00 | |||
| Abstentions | 21 887 | 32,54 | 23 179 | 34,46 | |||
| Votants | 45 374 | 67,46 | 44 077 | 65,54 | |||
| Blancs et nuls | 1 406 | 3,1 | 1 792 | 4,07 | |||
| Exprimés | 43 968 | 96,9 | 42 285 | 95,93 | |||
| Source : Assemblée nationale | |||||||
Neuvième circonscription (Béthune)
| Candidat | Parti | Premier tour | Second tour | ||||
|---|---|---|---|---|---|---|---|
| Voix | % | Voix | % | ||||
| André Flajolet élu | UMP | 15 213 | 29,96 | 24 525 | 50,54 | ||
| Marie-Noëlle Lienemann | PS | 14 625 | 28,8 | 24 003 | 49,46 | ||
| Bernard Seux sortant | Pôle républicain | 5 120 | 10,08 | ||||
| Evelyne Géronnez | FN | 5 107 | 10,06 | ||||
| Lucien Andries | PCF | 4 803 | 9,46 | ||||
| Jean-Pierre Méresse | CPNT | 1 373 | 2,7 | ||||
| Joël Caron | Les Verts | 1 187 | 2,34 | ||||
| Anne-Marie Duez | Divers droite | 1 020 | 2,01 | ||||
| Jean-Paul Wallard | LO | 841 | 1,66 | ||||
| Leila Benallègue | LCR | 478 | 0,94 | ||||
| Michel Hecquet | MÉI | 395 | 0,78 | ||||
| Pascal Férey | MNR | 387 | 0,76 | ||||
| Katia Scotto Di Apollonia | GÉ | 139 | 0,27 | ||||
| Pierre Prévot | Extrême gauche | 97 | 0,19 | ||||
| Inscrits | 79 657 | 100,00 | 79 654 | 100,00 | |||
| Abstentions | 27 337 | 34,32 | 27 909 | 35,04 | |||
| Votants | 52 320 | 65,68 | 51 745 | 64,96 | |||
| Blancs et nuls | 1 535 | 2,93 | 3 217 | 6,22 | |||
| Exprimés | 50 785 | 97,07 | 48 528 | 93,78 | |||
Dixième circonscription (Bruay-la-Buissière)
| Candidat | Parti | Premier tour | Second tour | ||||
|---|---|---|---|---|---|---|---|
| Voix | % | Voix | % | ||||
| Serge Janquin sortant réélu | PS | 15 490 | 37,62 | 24 096 | 67,22 | ||
| Isabelle Morel | UMP | 7 062 | 17,15 | 11 749 | 32,78 | ||
| Daniel Dewalle | PCF | 6 773 | 16,45 | ||||
| Jean-Baptiste Morchipont | FN | 5 871 | 14,26 | ||||
| Marie-Danièle Duquenne | LO | 1 193 | 2,9 | ||||
| Alice Alexandre | CPNT | 775 | 1,88 | ||||
| Xavier Morel | LCR | 773 | 1,88 | ||||
| Nathalie Voegelé | Les Verts | 755 | 1,83 | ||||
| Claudine Lescouf | MPF | 692 | 1,68 | ||||
| Jean-Claude Baziuk | Pôle républicain | 635 | 1,54 | ||||
| Michel Klock | RPF | 452 | 1,1 | ||||
| Michelle Trouvillez | MÉI | 297 | 0,72 | ||||
| Emmanuel Rignaux | MNR | 280 | 0,68 | ||||
| Malika Benyettou | GÉ | 130 | 0,32 | ||||
| Nicodème Knopik | Divers | 0 | 0 | ||||
| Inscrits | 72 038 | 100,00 | 72 028 | 100,00 | |||
| Abstentions | 29 280 | 40,65 | 33 462 | 46,46 | |||
| Votants | 42 758 | 59,35 | 38 566 | 53,54 | |||
| Blancs et nuls | 1 580 | 3,7 | 2 721 | 7,06 | |||
| Exprimés | 41 178 | 96,3 | 35 845 | 92,94 | |||
Onzième circonscription (Carvin)
| Candidat | Parti | Premier tour | Second tour | ||||
|---|---|---|---|---|---|---|---|
| Voix | % | Voix | % | ||||
| Marcel Cabiddu sortant réélu | PS | 16 404 | 30,16 | 32 078 | 69,03 | ||
| Éric Iorio | FN | 10 047 | 18,47 | 14 390 | 30,97 | ||
| Myriam Wonterghem Billiaux | UMP | 7 322 | 13,46 | ||||
| Rémy Auchedé | diss. PCF | 6 303 | 11,59 | ||||
| Annie Delannoy Jumez | UDF | 4 899 | 9,01 | ||||
| Muriel Dutrieu | PCF | 1 750 | 3,22 | ||||
| Jacques Switalski | Les Verts | 1 423 | 2,62 | ||||
| Régis Scheenaerts | LO | 1 229 | 2,26 | ||||
| Chantal Creton | CPNT | 960 | 1,77 | ||||
| Cathy Burgeat | Divers | 902 | 1,66 | ||||
| Séverine Duval | LCR | 835 | 1,54 | ||||
| Marcel Part | MNR | 644 | 1,18 | ||||
| Bernadette Dury | MPF | 611 | 1,12 | ||||
| David Masson | Divers droite | 573 | 1,05 | ||||
| Murielle Richet | MÉI | 304 | 0,56 | ||||
| Éliane Steigner | GÉ | 182 | 0,33 | ||||
| Inscrits | 91 864 | 100,00 | 91 864 | 100,00 | |||
| Abstentions | 35 641 | 38,8 | 40 191 | 43,75 | |||
| Votants | 56 223 | 61,2 | 51 673 | 56,25 | |||
| Blancs et nuls | 1 835 | 3,26 | 5 205 | 10,07 | |||
| Exprimés | 54 388 | 96,74 | 46 468 | 89,93 | |||
Douzième circonscription (Liévin)
| Candidat | Parti | Premier tour | Second tour | ||||
|---|---|---|---|---|---|---|---|
| Voix | % | Voix | % | ||||
| Jean-Pierre Kucheida sortant réélu | PS | 19 294 | 43,71 | 28 147 | 74,08 | ||
| Louis Lecoeuvre | FN | 7 085 | 16,05 | 9 847 | 25,92 | ||
| Jeanine Duquesne | UMP | 5 556 | 12,59 | ||||
| Cathy Apourceau-Poly | PCF | 4 554 | 10,32 | ||||
| Bernard Urbaniak | Pôle républicain | 1 878 | 4,25 | ||||
| Nathalie Hubert | LO | 1 289 | 2,92 | ||||
| Daniel Ludwikowski | Les Verts | 1 207 | 2,73 | ||||
| Sylviane Charles | LCR | 772 | 1,75 | ||||
| Rosemonde Lefrancq | CPNT | 637 | 1,44 | ||||
| Marie-Paule Vasselle | MNR | 446 | 1,01 | ||||
| Henri Bailleul | MÉI | 439 | 0,99 | ||||
| Christian Guffroy | PT | 404 | 0,92 | ||||
| Annette Parra | GÉ | 282 | 0,64 | ||||
| Cendrine Duriez | Extrême gauche | 165 | 0,37 | ||||
| Murielle Drelon | Divers gauche | 137 | 0,31 | ||||
| Inscrits | 77 668 | 100,00 | 77 667 | 100,00 | |||
| Abstentions | 31 938 | 41,12 | 36 094 | 46,47 | |||
| Votants | 45 730 | 58,88 | 41 573 | 53,53 | |||
| Blancs et nuls | 1 585 | 3,47 | 3 579 | 8,61 | |||
| Exprimés | 44 145 | 96,53 | 37 994 | 91,39 | |||
Treizième circonscription (Lens)
| Candidat | Parti | Premier tour | Second tour | ||||
|---|---|---|---|---|---|---|---|
| Voix | % | Voix | % | ||||
| Jean-Claude Bois sortant réélu | PS | 16 120 | 38,2 | 25 710 | 67,7 | ||
| Marine Le Pen | FN | 10 228 | 24,24 | 12 266 | 32,3 | ||
| Yvan Druon | PCF | 5 876 | 13,93 | ||||
| Béatrice Permuy | UMP | 5 628 | 13,34 | ||||
| Christine Degrugillier | Les Verts | 772 | 1,83 | ||||
| Renata Stankowiak | LO | 753 | 1,78 | ||||
| Patricia Nowak | Divers écologiste | 625 | 1,48 | ||||
| Gustave Ansart | Pôle républicain | 558 | 1,32 | ||||
| Isabelle Krzywkowski | LCR | 421 | 1 | ||||
| Marie-Josée Barbet | MNR | 403 | 0,96 | ||||
| Marc Thorel | MÉI | 294 | 0,7 | ||||
| Micheline Ben Mohamed | CPNT | 284 | 0,67 | ||||
| Naceira Vincent | Extrême gauche | 146 | 0,35 | ||||
| Alexandra Nguyen-Van-Gam | Divers écologiste | 87 | 0,21 | ||||
| Inscrits | 71 606 | 100,00 | 71 606 | 100,00 | |||
| Abstentions | 28 338 | 39,57 | 31 360 | 43,8 | |||
| Votants | 43 268 | 60,43 | 40 246 | 56,2 | |||
| Blancs et nuls | 1 073 | 2,48 | 2 270 | 5,64 | |||
| Exprimés | 42 195 | 97,52 | 37 976 | 94,36 | |||
Quatorzième circonscription (Hénin-Beaumont)
| Candidat | Parti | Premier tour | Second tour | ||||
|---|---|---|---|---|---|---|---|
| Voix | % | Voix | % | ||||
| Albert Facon sortant réélu | PS | 11 469 | 26,23 | 25 683 | 67,92 | ||
| Steeve Briois | FN | 8 768 | 20,06 | 12 129 | 32,08 | ||
| Gérard Dalongeville | Pôle républicain | 6 314 | 14,44 | ||||
| Jean Urbaniak | Divers droite | 5 353 | 12,24 | ||||
| Bernard Czerwinski | PCF | 4 846 | 11,08 | ||||
| Muriel Bury-Crombez | UMP | 3 354 | 7,67 | ||||
| Pascaline Blanchard | Les Verts | 670 | 1,53 | ||||
| Dominique Guidon | LO | 609 | 1,39 | ||||
| Philippe Burgeat | Divers écologiste | 587 | 1,34 | ||||
| Sandrine Cypryszczak | LCR | 438 | 1 | ||||
| Hélène Deroo | CPNT | 333 | 0,76 | ||||
| Saverio Maldonato | Divers gauche | 288 | 0,66 | ||||
| Philippe Martel | MÉI | 248 | 0,57 | ||||
| Mohamed Benhammou | Divers gauche | 235 | 0,54 | ||||
| Jean-Marie Monka | Divers droite | 206 | 0,47 | ||||
| Antoinette Cammilleri | GÉ | 0 | 0 | ||||
| Inscrits | 74 065 | 100,00 | 74 065 | 100,00 | |||
| Abstentions | 29 416 | 39,72 | 33 357 | 45,04 | |||
| Votants | 44 649 | 60,28 | 40 708 | 54,96 | |||
| Blancs et nuls | 931 | 2,09 | 2 896 | 7,11 | |||
| Exprimés | 43 718 | 97,91 | 37 812 | 92,89 | |||
| Source : Ministère de l'Intérieur | |||||||
Articles connexes
Notes et références
Cet article est issu de wikipedia. Text licence: CC BY-SA 4.0, Des conditions supplémentaires peuvent s’appliquer aux fichiers multimédias.