ûlections cantonales de 2004 dans la Haute-SaûÇne
Les ûˋlections cantonales ont eu lieu les 21 et .
| ||||||||||||||
| ûlections cantonales de 2004 dans la Haute-SaûÇne | ||||||||||||||
| 16 des 32 cantons de Haute-SaûÇne | ||||||||||||||
|---|---|---|---|---|---|---|---|---|---|---|---|---|---|---|
| 21 et | ||||||||||||||
| Type dãûˋlection | ûlections cantonales | |||||||||||||
| Corps ûˋlectoral et rûˋsultats | ||||||||||||||
| Inscrits | 83 724 | |||||||||||||
| Votants au 1er tour | 57 927 | |||||||||||||
| 69,19ã?/span>% | ||||||||||||||
| Votes exprimûˋs au 1er tour | 54 992 | |||||||||||||
| Votants au 2d tour | 47 682 | |||||||||||||
| 72,84ã?/span>% | ||||||||||||||
| Votes exprimûˋs au 2d tour | 44 137 | |||||||||||||
| PS ã?/strong> Yves Krattinger | ||||||||||||||
| Voix au 1er tour | 21 607 | |||||||||||||
| 39,30ã?/span>% | ||||||||||||||
| Voix au 2e tour | 23 539 | |||||||||||||
| 53,33ã?/span>% | ||||||||||||||
| Siû´ges obtenus | 23 | |||||||||||||
| UMP | ||||||||||||||
| Voix au 1er tour | 17 004 | |||||||||||||
| 30,93ã?/span>% | ||||||||||||||
| Voix au 2e tour | 18 380 | |||||||||||||
| 41,64ã?/span>% | ||||||||||||||
| Siû´ges obtenus | 9 | |||||||||||||
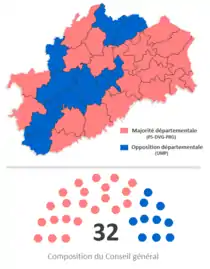
| Rûˋsultats par canton et composition du conseil gûˋnûˋral | ||||||||||||||
| ||||||||||||||
| Prûˋsident du conseil gûˋnûˋral | ||||||||||||||
| Sortant | ûlu | |||||||||||||
| Yves Krattinger PS |
Yves Krattinger PS | |||||||||||||
û l'issue de ces ûˋlections, le socialiste Yves Krattinger est rûˋûˋlu pour un deuxiû´me mandat û la tûˆte du conseil gûˋnûˋral.
Contexte dûˋpartemental
Assemblûˋe dûˋpartementale sortante
Avant les ûˋlections, le conseil gûˋnûˋral de la Haute-SaûÇne est prûˋsidûˋ par Yves Krattinger (PS). Il comprend 32 conseillers gûˋnûˋraux issus des 32 cantons de la Haute-SaûÇne. 16 d'entre eux sont renouvelables lors de ces ûˋlections.
| Parti | Sigle | ûlus |
|---|---|---|
| Majoritûˋ (18 siû´ges) | ||
| Parti socialiste | PS | 10 |
| Divers gauche | DVG | 6 |
| Parti radical de gauche | PRG | 1 |
| Parti communiste franûÏais | PCF | 1 |
| Opposition (14 ûˋlus) | ||
| Union pour un mouvement populaire | UMP | 13 |
| Union pour la dûˋmocratie franûÏaise | UFG | 1 |
| Prûˋsident du Conseil gûˋnûˋral | ||
| Yves Krattinger (PS) | ||
Rûˋsultats û l'ûˋchelle du dûˋpartement
| ûtiquette | Premier tour | Second tour | Siû´ges | |||
|---|---|---|---|---|---|---|
| Voix | % | Voix | % | |||
| Parti socialiste | 10 211 | 18,57 | 9 790 | 22,18 | 6 | |
| Divers gauche | 9 891 | 17,99 | 11 451 | 25,94 | 7 | |
| Parti communiste franûÏais | 4 131 | 7,51 | 2 218 | 5,03 | 0 | |
| Parti radical de gauche | 1 505 | 2,74 | 2 298 | 5,21 | 1 | |
| Extrûˆme gauche | 1 235 | 2,25 | ||||
| Les Verts | 887 | 1,61 | ||||
| Gauche | 27 860 | 50,67 | 25 757 | 58,36 | 14 | |
| Union pour un mouvement populaire | 13 878 | 25,24 | 13 144 | 29,78 | 2 | |
| Front national | 8 540 | 15,53 | 5 236 | 11,86 | 0 | |
| Union pour la dûˋmocratie franûÏaise | 2 021 | 3,68 | ||||
| Divers droite | 1 105 | 2,01 | ||||
| Droite | 25 544 | 46,46 | 18 380 | 41,64 | 2 | |
| Divers | 1 498 | 2,72 | ||||
| Rûˋgionalistes | 90 | 0,16 | ||||
| Inscrits | 83 724 | 100,00 | 65 463 | 100,00 | ||
| Abstention | 25 797 | 30,81 | 17 781 | 27,16 | ||
| Votants | 57 927 | 69,19 | 47 682 | 72,84 | ||
| Blancs et nuls | 2 935 | 5,07 | 3 545 | 7,43 | ||
| Exprimûˋs | 54 992 | 94,93 | 44 137 | 92,57 | ||
Rûˋsultats en nombre de siû´ges
Assemblûˋe dûˋpartementale û l'issue des ûˋlections
| Parti | Sigle | ûlus |
|---|---|---|
| Majoritûˋ (21 siû´ges) | ||
| Parti socialiste | PS | 12 |
| Divers gauche | DVG | 9 |
| Parti radical de gauche | PRG | 2 |
| Opposition (9 ûˋlus) | ||
| Union pour un mouvement populaire | UMP | 9 |
| Prûˋsident du Conseil gûˋnûˋral | ||
| Yves Krattinger (PS) | ||
Rûˋsultats par canton
Canton d'Amance
| Candidats | ûtiquette | Premier tour | ||
|---|---|---|---|---|
| Voix | % | |||
| Jean-Paul Pugin* | DVG | 1 338 | 56,98 | |
| Lucette Rambaux | UMP | 634 | 27,00 | |
| Roland Pagani | FN | 241 | 10,26 | |
| Fabienne Lievin | PCF | 135 | 5,75 | |
| Inscrits | 3 348 | 100,00 | ||
| Abstention | 880 | 26,28 | ||
| Votants | 2 468 | 73,72 | ||
| Blancs et nuls | 120 | 4,86 | ||
| Exprimûˋs | 2 348 | 95,14 | ||
*sortant
Canton d'Autrey-lû´s-Gray
| Candidats | ûtiquette | Premier tour | Second tour | |||
|---|---|---|---|---|---|---|
| Voix | % | Voix | % | |||
| Henri Blanchot* | PS | 1 248 | 45,30 | 1 599 | 52,95 | |
| Alain Blinette | UMP | 1 103 | 40,04 | 1 421 | 47,05 | |
| Fabien Senger | FN | 294 | 10,67 | |||
| Joû¨lle Bugnet | EXG | 110 | 3,99 | |||
| Inscrits | 4 040 | 100,00 | 4 040 | 100,00 | ||
| Abstention | 1 188 | 29,41 | 898 | 22,23 | ||
| Votants | 2 852 | 70,59 | 3 142 | 77,77 | ||
| Blancs et nuls | 97 | 3,40 | 122 | 3,88 | ||
| Exprimûˋs | 2 755 | 96,60 | 3 020 | 96,12 | ||
*sortant
Canton de Champagney
| Candidats | ûtiquette | Premier tour | Second tour | |||
|---|---|---|---|---|---|---|
| Voix | % | Voix | % | |||
| Gûˋrard Poivey | PRG | 1 505 | 26,70 | 2 298 | 38,54 | |
| Roland Germain | PCF | 1 492 | 26,47 | 2 218 | 37,20 | |
| Anne-Marie Jeanmougin | FN | 1 289 | 22,87 | 1 446 | 24,25 | |
| Renûˋe Portolleau | UMP | 775 | 13,75 | |||
| Dominique Egloff | UDF | 295 | 5,23 | |||
| Michel Cairoli | EXG | 280 | 4,97 | |||
| Inscrits | 9 006 | 100,00 | 9 006 | 100,00 | ||
| Abstention | 3 078 | 34,18 | 2 687 | 29,84 | ||
| Votants | 5 928 | 65,82 | 6 319 | 70,16 | ||
| Blancs et nuls | 292 | 4,93 | 357 | 5,65 | ||
| Exprimûˋs | 5 636 | 95,07 | 5 962 | 94,35 | ||
Canton de Champlitte
| Candidats | ûtiquette | Premier tour | Second tour | |||
|---|---|---|---|---|---|---|
| Voix | % | Voix | % | |||
| Yvonne Gousserey | DVG | 578 | 33,03 | 849 | 46,70 | |
| Marcel Riff* | UMP | 542 | 30,97 | 725 | 39,88 | |
| Bernard Thierry | DVD | 310 | 17,71 | |||
| Marcel Grognu | FN | 290 | 16,57 | 244 | 13,42 | |
| Jean-Pierre Poinsot | PCF | 30 | 1,71 | |||
| Inscrits | 2 319 | 100,00 | 2 319 | 100,00 | ||
| Abstention | 507 | 21,86 | 427 | 18,41 | ||
| Votants | 1 812 | 78,14 | 1 892 | 81,59 | ||
| Blancs et nuls | 62 | 3,42 | 74 | 3,91 | ||
| Exprimûˋs | 1 750 | 96,58 | 1 818 | 96,09 | ||
*sortant
Canton de Combeaufontaine
| Candidats | ûtiquette | Premier tour | Second tour | |||
|---|---|---|---|---|---|---|
| Voix | % | Voix | % | |||
| Joû¨lle Laure Libersa* | DVG | 961 | 49,13 | 1 245 | 61,33 | |
| Robert Bourgoin | UMP | 662 | 33,84 | 785 | 38,67 | |
| Geneviû´ve Maret | FN | 251 | 12,83 | |||
| Daniel Grux | PCF | 82 | 4,19 | |||
| Inscrits | 2 672 | 100,00 | 2 669 | 100,00 | ||
| Abstention | 637 | 23,84 | 528 | 19,78 | ||
| Votants | 2 035 | 76,16 | 2 141 | 80,22 | ||
| Blancs et nuls | 79 | 3,88 | 111 | 5,18 | ||
| Exprimûˋs | 1 956 | 96,12 | 2 030 | 94,82 | ||
*sortant
Canton de Dampierre-sur-Salon
| Candidats | ûtiquette | Premier tour | ||
|---|---|---|---|---|
| Voix | % | |||
| Charles Gauthier* | UMP | 1 743 | 58,22 | |
| Jean-Paul Carteret | PS | 835 | 27,89 | |
| Yves Marchois | FN | 257 | 8,58 | |
| Jean-FranûÏois Gaffard | Verts | 106 | 3,54 | |
| Michel Carry | PCF | 53 | 1,77 | |
| Inscrits | 4 110 | 100,00 | ||
| Abstention | 1 009 | 24,55 | ||
| Votants | 3 101 | 75,45 | ||
| Blancs et nuls | 107 | 3,45 | ||
| Exprimûˋs | 2 994 | 96,55 | ||
*sortant
Canton de Faucogney-et-la-Mer
| Candidats | ûtiquette | Premier tour | Second tour | |||
|---|---|---|---|---|---|---|
| Voix | % | Voix | % | |||
| Laurent Seguin | DVG | 1 350 | 49,85 | 1 734 | 61,62 | |
| Michel Leuvrey | UMP | 939 | 34,68 | 1 080 | 38,38 | |
| Michel Marain | FN | 156 | 5,76 | |||
| Michel Gaillard | Verts | 153 | 5,65 | |||
| Rûˋmy VanûÏon | REG | 90 | 3,32 | |||
| Josette Gruszka | PCF | 20 | 0,74 | |||
| Inscrits | 3 597 | 100,00 | 3 598 | 100,00 | ||
| Abstention | 745 | 20,71 | 615 | 17,09 | ||
| Votants | 2 852 | 79,29 | 2 983 | 82,91 | ||
| Blancs et nuls | 144 | 5,05 | 169 | 5,67 | ||
| Exprimûˋs | 2 708 | 94,95 | 2 814 | 94,33 | ||
Canton de Fresne-Saint-Mamû´s
| Candidats | ûtiquette | Premier tour | Second tour | |||
|---|---|---|---|---|---|---|
| Voix | % | Voix | % | |||
| Andrûˋ Huguin* | UMP | 994 | 43,56 | 1 328 | 53,68 | |
| Didier Pierre | DVG | 753 | 33,00 | 1 146 | 46,32 | |
| Samuel Fischer | FN | 314 | 13,76 | |||
| Manuel Messey | DVG | 174 | 7,62 | |||
| Josûˋ Pallares | PCF | 47 | 2,06 | |||
| Inscrits | 3 416 | 100,00 | 3 414 | 100,00 | ||
| Abstention | 965 | 28,25 | 734 | 21,50 | ||
| Votants | 2 451 | 71,75 | 2 680 | 78,50 | ||
| Blancs et nuls | 169 | 6,90 | 206 | 7,69 | ||
| Exprimûˋs | 2 282 | 93,10 | 2 474 | 92,31 | ||
*sortant
Canton d'Hûˋricourt-Est
| Candidats | ûtiquette | Premier tour | ||
|---|---|---|---|---|
| Voix | % | |||
| Jean-Michel Villaumûˋ* | PS | 2 278 | 51,69 | |
| Edith Bredier | FN | 944 | 21,42 | |
| Anne-Marie Bouche | UMP | 614 | 13,93 | |
| Philippe Belmont | PCF | 318 | 7,22 | |
| Noû¨l Hennequin | EXG | 253 | 5,74 | |
| Inscrits | 7 260 | 100,00 | ||
| Abstention | 2 560 | 35,26 | ||
| Votants | 4 700 | 64,74 | ||
| Blancs et nuls | 293 | 6,23 | ||
| Exprimûˋs | 4 407 | 93,77 | ||
*sortant
Canton de Hûˋricourt-Ouest
| Candidats | ûtiquette | Premier tour | Second tour | |||
|---|---|---|---|---|---|---|
| Voix | % | Voix | % | |||
| Jean-Pierre Michel* | DVG | 1 699 | 38,33 | 2 919 | 65,35 | |
| FranûÏois Pouthier | FN | 974 | 21,97 | 1 548 | 34,65 | |
| Jean-Luc Habermacher | UDF | 631 | 14,23 | |||
| Gilles Lazar | PCF | 522 | 11,78 | |||
| Jacques Duchene | DVD | 328 | 7,40 | |||
| Sabine Duc | EXG | 279 | 6,29 | |||
| Inscrits | 6 935 | 100,00 | 6 935 | 100,00 | ||
| Abstention | 2 209 | 31,85 | 1 990 | 28,70 | ||
| Votants | 4 726 | 68,15 | 4 945 | 71,30 | ||
| Blancs et nuls | 293 | 6,20 | 478 | 9,67 | ||
| Exprimûˋs | 4 433 | 93,80 | 4 467 | 90,33 | ||
*sortant
Canton de Jussey
| Candidats | ûtiquette | Premier tour | Second tour | |||
|---|---|---|---|---|---|---|
| Voix | % | Voix | % | |||
| Georges Lasne* | UMP | 916 | 28,46 | 1 415 | 41,56 | |
| Michel Desirûˋ | DVG | 822 | 25,54 | 1 990 | 58,44 | |
| Fabienne Oberlaender | PS | 615 | 19,11 | |||
| Jean Baudoncourt | FN | 336 | 10,44 | |||
| Frûˋdûˋric Buisson | UDF | 327 | 10,16 | |||
| FranûÏois Monin | PCF | 202 | 6,28 | |||
| Inscrits | 4 843 | 100,00 | 4 843 | 100,00 | ||
| Abstention | 1 482 | 30,60 | 1 236 | 25,52 | ||
| Votants | 3 361 | 69,40 | 3 607 | 74,48 | ||
| Blancs et nuls | 143 | 4,25 | 202 | 5,60 | ||
| Exprimûˋs | 3 218 | 95,75 | 3 405 | 94,40 | ||
*sortant
Canton de Lure-Nord
| Candidats | ûtiquette | Premier tour | Second tour | |||
|---|---|---|---|---|---|---|
| Voix | % | Voix | % | |||
| Michel Federspiel* | PS | 1 212 | 30,83 | 2 318 | 60,29 | |
| Claude Thiebault | FN | 946 | 24,07 | 1 527 | 39,71 | |
| Frûˋdûˋric Marlier | UMP | 653 | 16,61 | |||
| Philippe Lamboley | SE | 436 | 11,09 | |||
| Renûˋ Morlot | PCF | 287 | 7,30 | |||
| Alain Genestier | DVG | 256 | 6,51 | |||
| Michel Py | EXG | 141 | 3,59 | |||
| Inscrits | 6 562 | 100,00 | 6 562 | 100,00 | ||
| Abstention | 2 351 | 35,83 | 2 072 | 31,58 | ||
| Votants | 4 211 | 64,17 | 4 490 | 68,42 | ||
| Blancs et nuls | 280 | 6,65 | 645 | 14,37 | ||
| Exprimûˋs | 3 931 | 93,35 | 3 845 | 85,63 | ||
*sortant
Canton de Luxeuil-les-Bains
| Candidats | ûtiquette | Premier tour | Second tour | |||
|---|---|---|---|---|---|---|
| Voix | % | Voix | % | |||
| Michel Gabillot* | DVG | 1 302 | 44,20 | 1 568 | 49,32 | |
| Didier Hua | UMP | 908 | 30,82 | 1 140 | 35,86 | |
| Colette Clerc | FN | 533 | 18,09 | 471 | 14,82 | |
| Jean-Marie Pozzebon | PCF | 203 | 6,89 | |||
| Inscrits | 5 079 | 100,00 | 5 079 | 100,00 | ||
| Abstention | 1 907 | 37,55 | 1 713 | 33,73 | ||
| Votants | 3 172 | 62,45 | 3 366 | 66,27 | ||
| Blancs et nuls | 226 | 7,12 | 187 | 5,56 | ||
| Exprimûˋs | 2 946 | 92,88 | 3 179 | 94,44 | ||
*sortant
Canton de Montbozon
| Candidats | ûtiquette | Premier tour | Second tour | |||
|---|---|---|---|---|---|---|
| Voix | % | Voix | % | |||
| Edwige Eme | PS | 749 | 24,18 | 1 779 | 60,59 | |
| Denis Vagnet | DVG | 658 | 21,25 | |||
| Gilbert Grangeot | UMP | 564 | 18,21 | 1 157 | 39,41 | |
| Geneviû´ve Docquin Wolfersperger | DVD | 467 | 15,08 | |||
| Patrice Froissard | FN | 395 | 12,75 | |||
| JûˋrûÇme Rohart | Verts | 138 | 4,46 | |||
| Simone Reichenbach | PCF | 126 | 4,07 | |||
| Inscrits | 4 353 | 100,00 | 4 353 | 100,00 | ||
| Abstention | 1 114 | 25,59 | 1 000 | 22,97 | ||
| Votants | 3 239 | 74,41 | 3 353 | 77,03 | ||
| Blancs et nuls | 142 | 4,38 | 417 | 12,44 | ||
| Exprimûˋs | 3 097 | 95,62 | 2 936 | 87,56 | ||
Canton de Noroy-le-Bourg
| Candidats | ûtiquette | Premier tour | ||
|---|---|---|---|---|
| Voix | % | |||
| Gûˋrard Bontour* | PS | 1 419 | 56,38 | |
| Michel Dussaucy | UDF | 768 | 30,51 | |
| Patrick Valot | FN | 270 | 10,73 | |
| Pierre Moureaux | PCF | 60 | 2,38 | |
| Inscrits | 3 451 | 100,00 | ||
| Abstention | 827 | 23,96 | ||
| Votants | 2 624 | 76,04 | ||
| Blancs et nuls | 107 | 4,08 | ||
| Exprimûˋs | 2 517 | 95,92 | ||
*sortant
Canton de Vesoul-Ouest
| Candidats | ûtiquette | Premier tour | Second tour | |||
|---|---|---|---|---|---|---|
| Voix | % | Voix | % | |||
| Alain Chrûˋtien* | UMP | 2 831 | 35,33 | 4 093 | 49,99 | |
| Martine Silvain | PS | 1 855 | 23,15 | 4 094 | 50,01 | |
| Pierre Lortet | SE | 1 062 | 13,25 | |||
| Jacques Bard | FN | 1 050 | 13,10 | |||
| Frûˋdûˋric Bernabe | PCF | 554 | 6,91 | |||
| Didier Chatelain | Verts | 490 | 6,11 | |||
| Yannick Chantrel | EXG | 172 | 2,15 | |||
| Inscrits | 12 733 | 100,00 | 12 645 | 100,00 | ||
| Abstention | 4 338 | 34,07 | 3 881 | 30,69 | ||
| Votants | 8 395 | 65,93 | 8 764 | 69,31 | ||
| Blancs et nuls | 381 | 4,54 | 577 | 6,58 | ||
| Exprimûˋs | 8 014 | 95,46 | 8 187 | 93,42 | ||
*sortant
Notes et rûˋfûˋrences
Voir aussi
Articles connexes
Cet article est issu de wikipedia. Texte licence: CC BY-SA 4.0, Des conditions supplûˋmentaires peuvent sãappliquer aux fichiers multimûˋdias.