Élections cantonales de 1970 dans le Finistère
Les élections cantonales françaises de 1970 ont eu lieu les et .
| Élections cantonales de 1970 dans le Finistère | |||||
| 22 des 43 cantons du Finistère | |||||
|---|---|---|---|---|---|
| les et | |||||
| Type d’élection | Élections cantonales | ||||
| Majorité départementale – André Colin | |||||
| Sièges obtenus | 23 | ||||
| Conseil général après les élections | |||||
| |||||
| Président du Conseil général | |||||
| Sortant | Élu | ||||
| André Colin CD |
André Colin CD | ||||
| Site du Conseil général du Finistère | |||||
Contexte départemental
Assemblée départementale sortante
| Parti | Sigle | Élus |
|---|---|---|
| Majorité (26 sièges) | ||
| Centre démocrate | CD | 20 |
| Centre national des indépendants et paysans | CNIP | 3 |
| Parti républicain, radical et radical-socialiste | Rad. | 3 |
| Gauche (9 sièges) | ||
| Parti socialiste | PS | 4 |
| Parti socialiste unifié | PSU | 3 |
| Parti communiste français | PCF | 2 |
| Opposition gaulliste (8 sièges) | ||
| Républicains indépendants | RI | 3 |
| Union des démocrates pour la République | UDR | 3 |
| Centre démocratie et progrès | CDP | 2 |
| Président du Conseil général | ||
| André Colin (CD) | ||
Résultats à l’échelle du département
Résultats en nombre de sièges
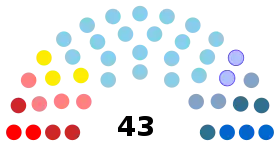
Assemblée départementale élue
| Parti | Sigle | Élus |
|---|---|---|
| Majorité (23 sièges) | ||
| Centre démocrate | CD | 17 |
| Centre national des indépendants et paysans | CNIP | 3 |
| Parti républicain, radical et radical-socialiste | Rad. | 3 |
| Gauche (11 sièges) | ||
| Parti socialiste | PS | 6 |
| Parti communiste français | PCF | 3 |
| Parti socialiste unifié | PSU | 2 |
| Opposition gaulliste (9 sièges) | ||
| Union des démocrates pour la République | UDR | 4 |
| Républicains indépendants | RI | 3 |
| Centre démocratie et progrès | CDP | 2 |
| Président du Conseil général | ||
| André Colin (CD) | ||
Résultats par canton
Canton de Brest-1
| Candidats | Étiquette | Premier tour | Second tour | |||
|---|---|---|---|---|---|---|
| Voix | % | Voix | % | |||
| Michel de Bennetot | UDR | 2 185 | 33,51 | 3 003 | 42,85 | |
| Louise Le Roux * | CD | 1 623 | 24,89 | 2 618 | 37,35 | |
| Louis Aminot | PCF | 948 | 14,54 | 1 350 | 19,26 | |
| Victor de Cadenet | App.RI | 846 | 12,97 | |||
| Francis Le Blé | PS | 777 | 11,92 | |||
| Hubert Pouliquen | CNIP | 100 | 1,53 | |||
| Marcel Galopin | CNIP | 42 | 0,64 | 38 | 0,54 | |
| Inscrits | 14 341 | 100,00 | 14 341 | 100,00 | ||
| Votants | 6 567 | 45,79 | 7 094 | 49,47 | ||
| Exprimés | 6 521 | 99,30 | 7 009 | 98,80 | ||
*sortant
Canton de Briec
| Candidats | Étiquette | Premier tour | ||
|---|---|---|---|---|
| Voix | % | |||
| Pierre Stéphan * | CD | 3 397 | 90,60 | |
| Théodore Le Coz | PCF | 349 | 9,40 | |
| Inscrits | 5 323 | 100,00 | ||
| Votants | 3 923 | 73,70 | ||
| Exprimés | 3 746 | 95,49 | ||
*sortant
Canton de Châteaulin
| Candidats | Étiquette | Premier tour | ||
|---|---|---|---|---|
| Voix | % | |||
| Édouard Le Jeune * | CD | 5 294 | 60,97 | |
| Jacques Le Guyader Desprées | CDP | 2 314 | 26,65 | |
| André Houillon | PCF | 1 075 | 12,38 | |
| Inscrits | 11 544 | 100,00 | ||
| Votants | 8 784 | 76,09 | ||
| Exprimés | 8 683 | 98,85 | ||
*sortant
Canton de Châteauneuf-du-Faou
| Candidats | Étiquette | Premier tour | Second tour | |||
|---|---|---|---|---|---|---|
| Voix | % | Voix | % | |||
| Louis Hémery * | PCF | 2 727 | 36,86 | 4 236 | 51,87 | |
| Georges Le Meur | CD | 1 377 | 18,61 | 3 930 | 48,13 | |
| Jean Hourmant | CNIP | 1 300 | 17,57 | |||
| Michel Hémery | CD | 1 187 | 16,05 | |||
| Renée Delaporte | EXD | 807 | 10,91 | |||
| Inscrits | 11 390 | 100,00 | 11 386 | 100,00 | ||
| Votants | 7 465 | 65,54 | 8 204 | 72,05 | ||
| Exprimés | 7 398 | 99,10 | 8 166 | 99,54 | ||
*sortant
Canton de Douarnenez
| Candidats | Étiquette | Premier tour | Second tour | |||
|---|---|---|---|---|---|---|
| Voix | % | Voix | % | |||
| Michel Mazéas | PCF | 4 456 | 39,85 | 5 617 | 47,63 | |
| Jean-Louis Tymen* | CD | 4 168 | 37,27 | 6 177 | 52,37 | |
| Marcel Le Gouill | UDR | 2 559 | 22,88 | |||
| Inscrits | 17 747 | 100,00 | 17 744 | 100,00 | ||
| Votants | 11 311 | 63,74 | 11 996 | 67,61 | ||
| Exprimés | 11 183 | 98,87 | 11 794 | 98,32 | ||
*sortant
Canton du Faou
| Candidats | Étiquette | Premier tour | ||
|---|---|---|---|---|
| Voix | % | |||
| Suzanne Ploux * | UDR | 2 284 | 63,13 | |
| André Le Roy | CD | 719 | 19,87 | |
| Pierre Sizun | PCF | 615 | 17,00 | |
| Inscrits | 5 181 | 100,00 | ||
| Votants | 3 699 | 71,40 | ||
| Exprimés | 3 618 | 97,81 | ||
*sortant
Canton d'Huelgoat
| Candidats | Étiquette | Premier tour | ||
|---|---|---|---|---|
| Voix | % | |||
| Alphonse Penven * | PCF | 3 043 | 81,74 | |
| Ned Urvoas | EXD (ex MOB) | 680 | 18,26 | |
| Inscrits | 5 845 | 100,00 | ||
| Votants | 3 960 | 67,75 | ||
| Exprimés | 3 723 | 94,02 | ||
*sortant
Canton de Landerneau
| Candidats | Étiquette | Premier tour | ||
|---|---|---|---|---|
| Voix | % | |||
| Théophile Le Borgne * | RI | 9 630 | 68,68 | |
| Jean Poullaouec | PS | 2 457 | 17,52 | |
| Guy Liziar | PCF | 1 935 | 13,80 | |
| Inscrits | 21 632 | 100,00 | ||
| Votants | 14 261 | 65,93 | ||
| Exprimés | 14 022 | 98,32 | ||
*sortant
Canton de Landivisiau
| Candidats | Étiquette | Premier tour | ||
|---|---|---|---|---|
| Voix | % | |||
| Yves Cabioch * | CD | 4 265 | 65,88 | |
| Emmanuel Pouliquen | App.UDR | 1 182 | 18,26 | |
| Albert Crenn | UDR | 728 | 11,24 | |
| Michel Boisseau | PCF | 299 | 4,62 | |
| Inscrits | 8 348 | 100,00 | ||
| Votants | 6 518 | 78,08 | ||
| Exprimés | 6 474 | 99,33 | ||
*sortant
Canton de Lesneven
| Candidats | Étiquette | Premier tour | ||
|---|---|---|---|---|
| Voix | % | |||
| Étienne Airiau * | RI | 8 568 | 94,58 | |
| Pierre Cauzien | PCF | 491 | 5,42 | |
| Inscrits | 12 919 | 100,00 | ||
| Votants | 9 295 | 71,95 | ||
| Exprimés | 9 059 | 97,46 | ||
*sortant
Canton de Morlaix
| Candidats | Étiquette | Premier tour | Second tour | |||
|---|---|---|---|---|---|---|
| Voix | % | Voix | % | |||
| Roger Prat * | PSU | 3 718 | 39,81 | 6 037 | 59,61 | |
| Ferdinand Le Graët | CD | 2 372 | 25,40 | 4 090 | 40,39 | |
| Émile Le Foll | PCF | 1 462 | 15,65 | |||
| Léon Kerlo | App.UDR | 1 382 | 14,80 | |||
| Jules Destables | PS | 406 | 4,35 | |||
| Inscrits | 15 325 | 100,00 | 15 325 | 100,00 | ||
| Votants | 9 521 | 62,13 | 10 348 | 67,52 | ||
| Exprimés | 9 340 | 98,10 | 10 127 | 97,86 | ||
*sortant
Canton d'Ouessant
André Colin (CD), président du Conseil Général depuis 1964 est réélu.
| Candidats | Étiquette | Premier tour | ||
|---|---|---|---|---|
| Voix | % | |||
| André Colin * | CD | 573 | 62,22 | |
| Joseph Le Bail | UDT | 331 | 35,94 | |
| Benjamin Manach | PCF | 17 | 1,85 | |
| Inscrits | 1 241 | 100,00 | ||
| Votants | 935 | 75,34 | ||
| Exprimés | 921 | 98,50 | ||
*sortant
Canton de Plogastel-Saint-Germain
| Candidats | Étiquette | Premier tour | Second tour | |||
|---|---|---|---|---|---|---|
| Voix | % | Voix | % | |||
| Armand Pavec * | CD | 3 513 | 42,36 | 5 138 | 58,97 | |
| Alfred Jolivet | PS | 2 395 | 28,88 | 3 575 | 41,03 | |
| Jean Perhirin | App.UDR | 1 512 | 18,23 | |||
| Albert Trividic | PCF | 874 | 10,54 | |||
| Inscrits | 12 470 | 100,00 | 12 470 | 100,00 | ||
| Votants | 8 384 | 67,23 | 8 803 | 70,59 | ||
| Exprimés | 8 294 | 98,93 | 8 713 | 98,98 | ||
*sortant
Canton de Ploudiry
| Candidats | Étiquette | Premier tour | ||
|---|---|---|---|---|
| Voix | % | |||
| Pierre Abéguilé * | CD | 1 641 | 87,01 | |
| Jean Quéré | PCF | 245 | 12,99 | |
| Inscrits | 2 641 | 100,00 | ||
| Votants | 1 984 | 75,12 | ||
| Exprimés | 1 886 | 95,06 | ||
*sortant
Canton de Plouigneau
| Candidats | Étiquette | Premier tour | Second tour | |||
|---|---|---|---|---|---|---|
| Voix | % | Voix | % | |||
| Édouard Rolland | App.UDR | 1 575 | 35,75 | 2 313 | 49,19 | |
| Armand Berthou | PS | 1 155 | 26,13 | 2 389 | 50,81 | |
| Albert Larher * | PSU | 868 | 19,63 | |||
| Jean Salou | PCF | 825 | 18,65 | |||
| Inscrits | 5 933 | 100,00 | 5 933 | 100,00 | ||
| Votants | 4 484 | 75,58 | 4 810 | 81,07 | ||
| Exprimés | 4 423 | 98,64 | 4 702 | 97,76 | ||
*sortant
Canton de Pont-Aven
| Candidats | Étiquette | Premier tour | ||
|---|---|---|---|---|
| Voix | % | |||
| Louis Orvoën * | CD | 4 535 | 65,63 | |
| Yves Cotty | PCF | 1 575 | 22,79 | |
| Lucien Nilias | PS | 800 | 11,58 | |
| Inscrits | 12 150 | 100,00 | ||
| Votants | 7 052 | 58,04 | ||
| Exprimés | 6 910 | 7,99 | ||
*sortant
Canton de Quimper
| Candidats | Étiquette | Premier tour | Second tour | |||
|---|---|---|---|---|---|---|
| Voix | % | Voix | % | |||
| René Coadou * | CD | 8 371 | 42,27 | 10 506 | 48,87 | |
| Léon Goraguer | PS | 7 047 | 35,58 | 10 994 | 51,13 | |
| Jean-François Hamon | PCF | 4 386 | 22,15 | |||
| Inscrits | 32 842 | 100,00 | 32 839 | 100,00 | ||
| Votants | 20 072 | 61,12 | 22 086 | 67,26 | ||
| Exprimés | 19 804 | 98,67 | 21 500 | 97,35 | ||
*sortant
Canton de Quimperlé
| Candidats | Étiquette | Premier tour | Second tour | |||
|---|---|---|---|---|---|---|
| Voix | % | Voix | % | |||
| Jean Charter * | Rad. | 3 187 | 42,25 | 4 322 | 56,84 | |
| Jean-Claude Petit | RI | 2 750 | 36,46 | 3 282 | 43,16 | |
| Jean Colas | PCF | 1 606 | 21,29 | |||
| Inscrits | 11 292 | 100,00 | 11 292 | 100,00 | ||
| Votants | 7 669 | 67,92 | 7 843 | 69,46 | ||
| Exprimés | 7 543 | 98,36 | 7 604 | 96,95 | ||
*sortant
Canton de Saint-Renan
Paul Lareur (CD), élu depuis 1945 ne se représente pas.
| Candidats | Étiquette | Premier tour | Second tour | |||
|---|---|---|---|---|---|---|
| Voix | % | Voix | % | |||
| André Cheminant | UDR | 2 847 | 34,18 | 3 670 | 43,54 | |
| Pierre Lucas | App.RI | 2 397 | 28,78 | 3 653 | 43,33 | |
| Jean-René Le Gall | CD (*) | 1 481 | 17,78 | |||
| Victor Martin | App.RI | 878 | 10,54 | |||
| Alain Créach | PSU | 531 | 6,38 | 564 | 6,69 | |
| Émile Guérenneur | PCF | 195 | 2,34 | |||
| Charles Minguy | CD | - | - | 543 | 6,44 | |
| Inscrits | 11 320 | 100,00 | 11 320 | 100,00 | ||
| Votants | 8 393 | 74,14 | 8 511 | 75,19 | ||
| Exprimés | 8 329 | 99,24 | 8 430 | 99,05 | ||
Canton de Scaër
| Candidats | Étiquette | Premier tour | ||
|---|---|---|---|---|
| Voix | % | |||
| Christophe Poulichet | PCF | 2 902 | 53,56 | |
| Pierre Le Bourhis * | UDR (ex CNIP) | 2 516 | 46,44 | |
| Inscrits | 6 955 | 100,00 | ||
| Votants | 5 568 | 80,06 | ||
| Exprimés | 5 418 | 97,31 | ||
*sortant
Canton de Sizun
| Candidats | Étiquette | Premier tour | ||
|---|---|---|---|---|
| Voix | % | |||
| François Manac'h * | PS | 2 152 | 94,30 | |
| Jean-Louis Prigent | PCF | 130 | 5,70 | |
| Inscrits | 3 466 | 100,00 | ||
| Votants | 2 487 | 71,76 | ||
| Exprimés | 2 282 | 91,76 | ||
*sortant
Canton de Taulé
| Candidats | Étiquette | Premier tour | ||
|---|---|---|---|---|
| Voix | % | |||
| Jean-Yves Corre * | Rad | 2 522 | 54,35 | |
| Marie Jacq | PSU | 1 906 | 41,08 | |
| René Le Bras | PCF | 212 | 4,57 | |
| Inscrits | 6 266 | 100,00 | ||
| Votants | 4 119 | 65,74 | ||
| Exprimés | 4 063 | 98,64 | ||
*sortant
Notes et références
Voir aussi
Articles connexes
- Arrondissements du Finistère
- Conseil général du Finistère
- Élections cantonales françaises de 1955
- Élections cantonales françaises de 1958
- Élections cantonales françaises de 1967
- Élections cantonales françaises de 1970
- Élections cantonales françaises de 1973
- Élections cantonales françaises de 1979
- Élections cantonales françaises de 2001
- Élections cantonales françaises de 2004
- Élections cantonales françaises de 2008
- Élections cantonales françaises de 2011
- Liste des cantons du Finistère
- Liste des communes du Finistère
- Liste des conseillers généraux du Finistère
Lien externe
Cet article est issu de wikipedia. Text licence: CC BY-SA 4.0, Des conditions supplémentaires peuvent s’appliquer aux fichiers multimédias.