Élections cantonales de 1973 dans le Finistère
Les élections cantonales françaises de 1973 ont eu lieu les et .
| Élections cantonales de 1973 dans le Finistère | |||||
| 25 des 48 cantons du Finistère | |||||
|---|---|---|---|---|---|
| les et | |||||
| Type d’élection | Élections cantonales | ||||
| Majorité départementale – André Colin | |||||
| Sièges obtenus | 20 | ||||
| Conseil général après élection | |||||
| |||||
| Président du Conseil général | |||||
| Sortant | Élu | ||||
| André Colin CD |
André Colin CD | ||||
| Site du Conseil général du Finistère | |||||
Contexte départemental
Assemblée départementale sortante
| Parti | Sigle | Élus |
|---|---|---|
| Majorité (23 sièges) | ||
| Centre démocrate | CD | 14 |
| Républicains indépendants | RI | 6 |
| Parti républicain, radical et radical-socialiste | Rad. | 3 |
| Gauche (11 sièges) | ||
| Parti socialiste | PS | 7 |
| Parti communiste français | PCF | 3 |
| Parti socialiste unifié | PSU | 1 |
| Opposition gaulliste (9 sièges) | ||
| Union des démocrates pour la République | UDR | 5 |
| Centre national des indépendants et paysans | CNIP | 3 |
| Centre démocratie et progrès | CDP | 1 |
| Président du Conseil général | ||
| André Colin (CD) | ||
Résultats à l’échelle du département
Résultats en nombre de sièges
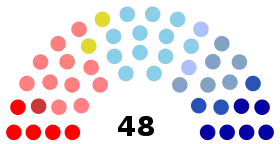
Assemblée départementale élue
| Parti | Sigle | Élus |
|---|---|---|
| Majorité (20 sièges) | ||
| Centre démocrate | CD | 12 |
| Républicains indépendants | RI | 6 |
| Parti républicain, radical et radical-socialiste | Rad/Dvg | 2 |
| Gauche (17 sièges) | ||
| Parti socialiste | PS | 11 |
| Parti communiste français | PCF | 5 |
| Parti socialiste unifié | PSU | 1 |
| UDR et apparentés (11 sièges) | ||
| Union des démocrates pour la République | UDR | 6 |
| Centre national des indépendants et paysans | CNIP | 3 |
| Centre démocratie et progrès | CDP | 2 |
| Président du Conseil général | ||
| André Colin (CD) | ||
Résultats par canton
Canton d'Arzano
| Candidats | Étiquette | Premier tour | ||
|---|---|---|---|---|
| Voix | % | |||
| Jean Fichoux * | RI (ex CNIP) | 1 266 | 64,92 | |
| Louis Le Rouzic | PS | 631 | 32,36 | |
| Bernard Bonnaire | PCF | 53 | 2,72 | |
| Inscrits | 2 704 | 100,00 | ||
| Votants | 1 980 | 73,23 | ||
| Exprimés | 1 950 | 98,49 | ||
*sortant
Canton de Bannalec
| Candidats | Étiquette | Premier tour | ||
|---|---|---|---|---|
| Voix | % | |||
| Pierre Boëdec * | PS | 3 315 | 68,52 | |
| Norbert Duigou | PCF | 1 300 | 26,87 | |
| René Hémery | PSU | 223 | 4,61 | |
| Inscrits | 8 330 | 100,00 | ||
| Votants | 5 179 | 62,17 | ||
| Exprimés | 4 838 | 93,42 | ||
*sortant
Nouveau Brest-I
Louis Marc (RI) était élu dans l'ancien canton de Brest-3.
| Candidats | Étiquette | Premier tour | Second tour | |||
|---|---|---|---|---|---|---|
| Voix | % | Voix | % | |||
| Louis Marc | RI (ex CNIP) | 1 965 | 32,52 | 3 169 | 46,43 | |
| Georges Kerdoncuff | PS | 1 806 | 29,89 | 3 657 | 53,57 | |
| Jean Pont | DVD-O | 1 531 | 25,34 | |||
| Jean-Claude Gourlay | PCF | 746 | 12,35 | |||
| Jean-Claude Gourlay | UDB | 354 | 5,86 | |||
| Inscrits | 11 908 | 100,00 | 11 908 | 100,00 | ||
| Votants | 6 487 | 54,48 | 6 952 | 58,38 | ||
| Exprimés | 6 042 | 93,14 | 6 826 | 98,19 | ||
Nouveau Brest-II
| Candidats | Étiquette | Premier tour | Second tour | |||
|---|---|---|---|---|---|---|
| Voix | % | Voix | % | |||
| Francis Le Blé | PS (ex CIR) | 2 494 | 37,27 | 4 456 | 58,51 | |
| Louise Le Roux | CD-MR | 2 494 | 37,27 | 3 160 | 41,49 | |
| Louis Le Roux | PCF | 1 500 | 22,42 | |||
| Michel Herjean | SAV | 203 | 3,03 | |||
| Inscrits | 14 457 | 100,00 | 14 457 | 100,00 | ||
| Votants | 6 769 | 46,82 | 7 697 | 53,24 | ||
| Exprimés | 6 691 | 98,85 | 7 616 | 98,95 | ||
Nouveau Brest-IV
Georges Lombard était élu dans l'ancien canton de Brest-2.
| Candidats | Étiquette | Premier tour | Second tour | |||
|---|---|---|---|---|---|---|
| Voix | % | Voix | % | |||
| Georges Lombard | CNIP-MR | 3 741 | 47,45 | 4 748 | 49,93 | |
| Jean-Marie Garrigou-Lagrange | PS | 2 179 | 27,64 | 4 762 | 50,07 | |
| Gabriel Paul | PCF | 1 433 | 18,17 | |||
| René L'Hostis | UDB | 532 | 6,75 | |||
| Inscrits | 16 501 | 100,00 | 16 501 | 100,00 | ||
| Votants | 8 092 | 49,04 | 9 706 | 58,82 | ||
| Exprimés | 7 885 | 97,44 | 9 510 | 97,98 | ||
Nouveau Brest-V
| Candidats | Étiquette | Premier tour | Second tour | |||
|---|---|---|---|---|---|---|
| Voix | % | Voix | % | |||
| Joseph Gourmelon | PS | 2 044 | 34,87 | 3 902 | 60,58 | |
| Joseph Tanguy | App.CD | 1 497 | 25,54 | 2 539 | 39,42 | |
| Jean Perrot | PCF | 1 348 | 23,00 | |||
| Maurice Guénanff | RI | 977 | 16,67 | |||
| Inscrits | 13 018 | 100,00 | 13 018 | 100,00 | ||
| Votants | 5 925 | 45,51 | 6 530 | 50,16 | ||
| Exprimés | 5 866 | 99,00 | 6 441 | 98,64 | ||
Nouveau Brest-VI
| Candidats | Étiquette | Premier tour | Second tour | |||
|---|---|---|---|---|---|---|
| Voix | % | Voix | % | |||
| Jacqueline Desouches | PS | 1 736 | 27,15 | 3 736 | 53,50 | |
| Hervé Floch | RI | 1 367 | 21,38 | 3 247 | 46,50 | |
| Ange Habasque | DVD-F | 1 212 | 18,96 | |||
| Yvonne Sider | PCF | 1 203 | 18,82 | |||
| Yves Hautin | App.CD-MR | 876 | 13,70 | |||
| Inscrits | 13 261 | 100,00 | 13 261 | 100,00 | ||
| Votants | 6 467 | 48,77 | 7 056 | 53,21 | ||
| Exprimés | 6 394 | 98,87 | 6 983 | 98,97 | ||
Nouveau Brest-7
Canton de Concarneau
Charles Linement (PS) élu depuis 1967 ne se représente pas.
| Candidats | Étiquette | Premier tour | Second tour | |||
|---|---|---|---|---|---|---|
| Voix | % | Voix | % | |||
| Robert Jan | PCF | 3 571 | 41,33 | 5 452 | 55,87 | |
| Yves Couchouron | App.UDR | 3 088 | 35,74 | 4 307 | 44,13 | |
| Eugène Le Roux | PS | 1 722 | 19,93 | |||
| Jean Beaufrère | SAV | 259 | 2,96 | |||
| Inscrits | 15 190 | 100,00 | 15 186 | 100,00 | ||
| Votants | 8 765 | 57,70 | 9 935 | 65,42 | ||
| Exprimés | 8 640 | 98,57 | 9 759 | 98,23 | ||
Canton de Crozon
| Candidats | Étiquette | Premier tour | Second tour | |||
|---|---|---|---|---|---|---|
| Voix | % | Voix | % | |||
| Louis Jacquin * | CNIP-Fav | 3 115 | 35,86 | 3 386 | 55,36 | |
| René Heise | PS | 1 401 | 23,75 | 2 690 | 44,64 | |
| Jean Kersalé | App.MR | 951 | 16,12 | |||
| Pierre Mesgouez | DVD-Maj | 812 | 13,77 | |||
| Pierre Plougonven | PCF | 619 | 10,51 | |||
| Inscrits | 11 457 | 11 472 | ||||
| Votants | 5 973 | 52,13 | 6 180 | 53,87 | ||
| Exprimés | 5 898 | 98,74 | 6 026 | 97,51 | ||
*sortant
Canton de Daoulas
| Candidats | Étiquette | Premier tour | Second tour | |||
|---|---|---|---|---|---|---|
| Voix | % | Voix | % | |||
| Joseph Malléjac * | App.CD-Maj | 2 803 | 39,16 | 3 400 | 45,14 | |
| André Kervella | DVD-Opp | 1 585 | 22,14 | 3 116 | 41,37 | |
| Robert Ricco | UDR | 1 571 | 21,95 | |||
| Roger Bonderf | PS | 810 | 11,31 | |||
| André Le Gac | PCF | 390 | 5,45 | |||
| Inscrits | 11 440 | 100,00 | 11 437 | 100,00 | ||
| Votants | 7 215 | 63,07 | 7 587 | 66,34 | ||
| Exprimés | 7 159 | 99,22 | 7 532 | 99,28 | ||
*sortant
Canton de Fouesnant
| Candidats | Étiquette | Premier tour | ||
|---|---|---|---|---|
| Voix | % | |||
| Louis Le Calvez * | CD-MR | 3 949 | 75,12 | |
| Jean-Paul Benot | PCF | 802 | 15,26 | |
| Louis Bizouarn | DVG | 506 | 9,63 | |
| Inscrits | 8 917 | 100,00 | ||
| Votants | 5 370 | 60,22 | ||
| Exprimés | 5 257 | 97,90 | ||
*sortant
Canton de Lanmeur
François-Tanguy Prigent (PSU) est mort en 1970. Yves Moal (PSU) a été élu lors de la partielle.
| Candidats | Étiquette | Premier tour | Second tour | |||
|---|---|---|---|---|---|---|
| Voix | % | Voix | % | |||
| Yves Moal * | PS (ex PSU) | 3 132 | 38,64 | 3 609 | 65,30 | |
| François Gautier | PCF | 1755 | 31,81 | |||
| Louis Fornier | UDR | 1 631 | 29,56 | 1 918 | 34,70 | |
| Inscrits | 8 044 | 100,00 | 8 040 | 100,00 | ||
| Votants | 5 571 | 69,26 | 5 617 | 69,86 | ||
| Exprimés | 5 518 | 99,05 | 5 527 | 98,40 | ||
*sortant
Canton de Lannilis
| Candidats | Étiquette | Premier tour | ||
|---|---|---|---|---|
| Voix | % | |||
| Léon Guéguen * | RI | 4 710 | 73,69 | |
| Jean-François Kervern | SAV | 929 | 14,53 | |
| Louis Plougoulm | PS | 661 | 10,34 | |
| Yvon Istin | PCF | 92 | 1,44 | |
| Inscrits | 9 442 | 100,00 | ||
| Votants | 6 512 | 68,97 | ||
| Exprimés | 6 392 | 98,16 | ||
*sortant
Canton de Plabennec
Gabriel de Poulpiquet (UDR) élu depuis 1945 ne se représente pas.
| Candidats | Étiquette | Premier tour | ||
|---|---|---|---|---|
| Voix | % | |||
| Jean-Louis Goasduff | UDR (*) | 4 438 | 76,94 | |
| Antoine Marzin | PSU | 1 100 | 19,07 | |
| Yvon Drévillon | PCF | 230 | 3,99 | |
| Inscrits | 7 990 | 100,00 | ||
| Votants | 5 944 | 74,39 | ||
| Exprimés | 5 768 | 97,04 | ||
Canton de Pleyben
| Candidats | Étiquette | Premier tour | ||
|---|---|---|---|---|
| Voix | % | |||
| Christian Savidan | DVD-Maj | 2 538 | 51,02 | |
| Yves Hamon * | CD-MR | 1 329 | 26,71 | |
| Jean-Yves Le Moal | DVD-Opp | 598 | 12,02 | |
| Yvon Pann | PCF | 397 | 7,98 | |
| Georges Lardeau | DVD-Maj | 113 | 2,27 | |
| Inscrits | 7 496 | 100,00 | ||
| Votants | 5 032 | 67,13 | ||
| Exprimés | 4 975 | 98,87 | ||
*sortant
Canton de Ploudalmézeau
| Candidats | Étiquette | Premier tour | ||
|---|---|---|---|---|
| Voix | % | |||
| Alphonse Arzel * | CD-MR | 4 072 | 70,74 | |
| Pierre Cadalen | SAV | 1 421 | 24,69 | |
| Paul Lespagnol | PCF | 263 | 4,57 | |
| Inscrits | 9 233 | 100,00 | ||
| Votants | 5 947 | 64,41 | ||
| Exprimés | 5 756 | 96,79 | ||
*sortant
Canton de Plouescat
| Candidats | Étiquette | Premier tour | ||
|---|---|---|---|---|
| Voix | % | |||
| Eugène Le Rue * | DVD-Maj (ex RI) | 3 793 | 93,10 | |
| Emmanuel Charles | PCF | 281 | 6,90 | |
| Inscrits | 6 834 | 100,00 | ||
| Votants | 4 205 | 61,53 | ||
| Exprimés | 4 074 | 96,85 | ||
*sortant
Canton de Plouzévédé
Eugène Quéméneur (RI) élu depuis 1949 ne se représente pas.
| Candidats | Étiquette | Premier tour | Second tour | |||
|---|---|---|---|---|---|---|
| Voix | % | Voix | % | |||
| Jacques de Menou | RI (*) | 2 473 | 48,48 | 2 968 | 55,14 | |
| Louis Mesguen | UDR | 1 570 | 30,78 | 2 412 | 44,86 | |
| Roger Le Clech | MR | 886 | 17,37 | |||
| Albert Le Bras | PCF | 1783 | 3,39 | |||
| Inscrits | 6 948 | 100,00 | 6 944 | 100,00 | ||
| Votants | 5 166 | 74,35 | 5 450 | 78,49 | ||
| Exprimés | 5 102 | 98,76 | 5 377 | 98,66 | ||
Canton de Pont-Croix
| Candidats | Étiquette | Premier tour | Second tour | |||
|---|---|---|---|---|---|---|
| Voix | % | Voix | % | |||
| Jean Sergent | CDP | 3 054 | 34,84 | 5 087 | 47,75 | |
| Hervé Gloaguen * | CNIP-MR | 1 485 | 16,94 | 1 539 | 14,45 | |
| Erwan Guéguen | PS | 1 439 | 16,42 | 4 028 | 37,81 | |
| Amélie Kerloch | PCF | 1 335 | 15,23 | |||
| Jean Cabillic | CNIP | 990 | 11,30 | |||
| Roger Vibert | CNIP | 461 | 5,26 | |||
| Inscrits | 16 805 | 100,00 | 16 796 | 100,00 | ||
| Votants | 8 868 | 52,77 | 10 729 | 63,88 | ||
| Exprimés | 8 764 | 98,83 | 10 654 | 99,30 | ||
*sortant
Canton de Pont-l'Abbé
| Candidats | Étiquette | Premier tour | Second tour | |||
|---|---|---|---|---|---|---|
| Voix | % | Voix | % | |||
| Henry Bénard * | CD-MR | 5 856 | 43,24 | 9 082 | 60,67 | |
| Albert Hénot | PCF | 3 669 | 27,09 | 5 888 | 39,33 | |
| Henri Péron | UDR | 2 400 | 17,72 | |||
| Jean Richard | PS | 1 613 | 11,91 | |||
| Inscrits | 24 669 | 100,00 | 24 662 | 100,00 | ||
| Votants | 13 717 | 55,60 | 15 275 | 61,94 | ||
| Exprimés | 13 538 | 98,70 | 14 970 | 98,00 | ||
*sortant
Canton de Rosporden
| Candidats | Étiquette | Premier tour | ||
|---|---|---|---|---|
| Voix | % | |||
| Louis Huitric * | PS | 1 987 | 55,35 | |
| Maurice Le Dain | MR | 1 032 | 28,75 | |
| Roger Sanséau | PCF | 571 | 15,91 | |
| Inscrits | 5 236 | 100,00 | ||
| Votants | 3 638 | 69,46 | ||
| Exprimés | 3 590 | 98,68 | ||
*sortant
Canton de Saint-Pol-de-Léon
| Candidats | Étiquette | Premier tour | ||
|---|---|---|---|---|
| Voix | % | |||
| François Prigent * | CD | 6 907 | 80,79 | |
| André Nadelec | PSU | 809 | 9,46 | |
| Andrée Moat | PCF | 506 | 5,92 | |
| Yves Ilvoas | UDB | 327 | 3,83 | |
| Inscrits | 14 589 | 100,00 | ||
| Votants | 8 668 | 59,42 | ||
| Exprimés | 8 549 | 98,63 | ||
*sortant
Canton de Saint-Thégonnec
| Candidats | Étiquette | Premier tour | ||
|---|---|---|---|---|
| Voix | % | |||
| Louis Guillou * | CDP (ex CD) | 2 276 | 71,55 | |
| Jean Cann | PSU | 579 | 18,20 | |
| Suzanne Ravet | PCF | 326 | 10,25 | |
| Inscrits | 4 734 | 100,00 | ||
| Votants | 3 228 | 68,19 | ||
| Exprimés | 3 181 | 98,54 | ||
*sortant
Notes et références
Voir aussi
Articles connexes
- Arrondissements du Finistère
- Conseil général du Finistère
- Élections cantonales françaises de 1945
- Élections cantonales françaises de 1949
- Élections cantonales françaises de 1951
- Élections cantonales françaises de 1955
- Élections cantonales françaises de 1964
- Élections cantonales françaises de 1967
- Élections cantonales françaises de 1970
- Liste des cantons du Finistère
- Liste des communes du Finistère
- Liste des conseillers généraux du Finistère
Lien externe
Cet article est issu de wikipedia. Text licence: CC BY-SA 4.0, Des conditions supplémentaires peuvent s’appliquer aux fichiers multimédias.